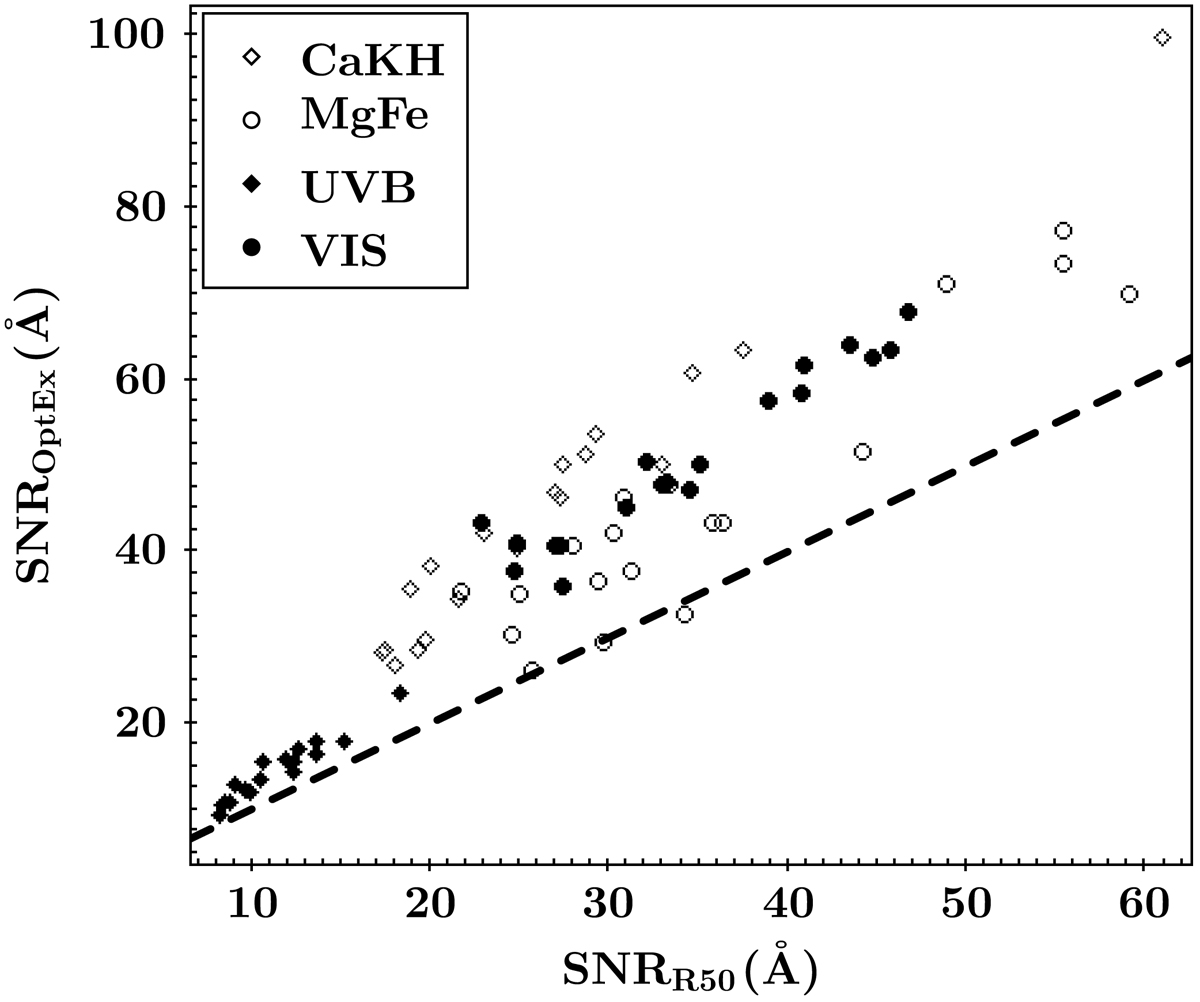
Fig. C.1.
Download original image
Comparison between the S/N obtained from the R50 spectra and that from the OptEx ones in the two arms (integrated, filled symbols) and around the Ca H and K doublet in UVB (computed in the region [3800−4000]Å, empty diamonds) and the MgFe lines in the VIS ([5000−5500]Å, empty circles). The S/N obtained from the optimally extracted spectra is in all but two cases above the one-to-one relation, which is plotted as dashed black line.
Current usage metrics show cumulative count of Article Views (full-text article views including HTML views, PDF and ePub downloads, according to the available data) and Abstracts Views on Vision4Press platform.
Data correspond to usage on the plateform after 2015. The current usage metrics is available 48-96 hours after online publication and is updated daily on week days.
Initial download of the metrics may take a while.