Free Access
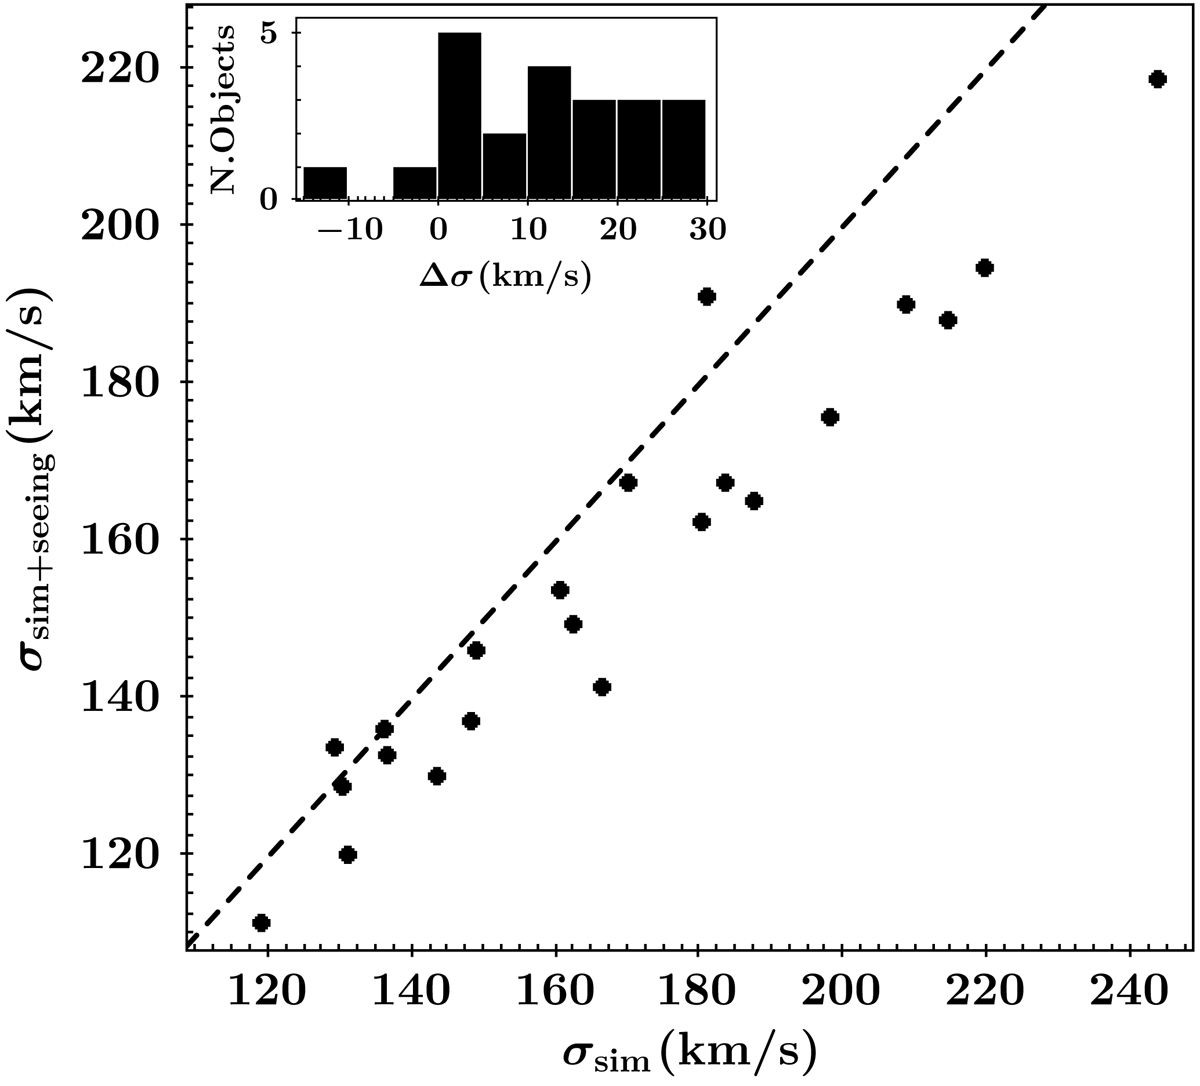
Fig. A.1.
Download original image
Velocity dispersion values measured for the simulated galaxies, without (x-axis) and with (y-axis) the seeing convolution. The histogram in the inset shows the difference between the σsim and σsim + seeing, which is positive in 21/22 cases, and never larger than 30 km/s.
Current usage metrics show cumulative count of Article Views (full-text article views including HTML views, PDF and ePub downloads, according to the available data) and Abstracts Views on Vision4Press platform.
Data correspond to usage on the plateform after 2015. The current usage metrics is available 48-96 hours after online publication and is updated daily on week days.
Initial download of the metrics may take a while.