Fig. 9.
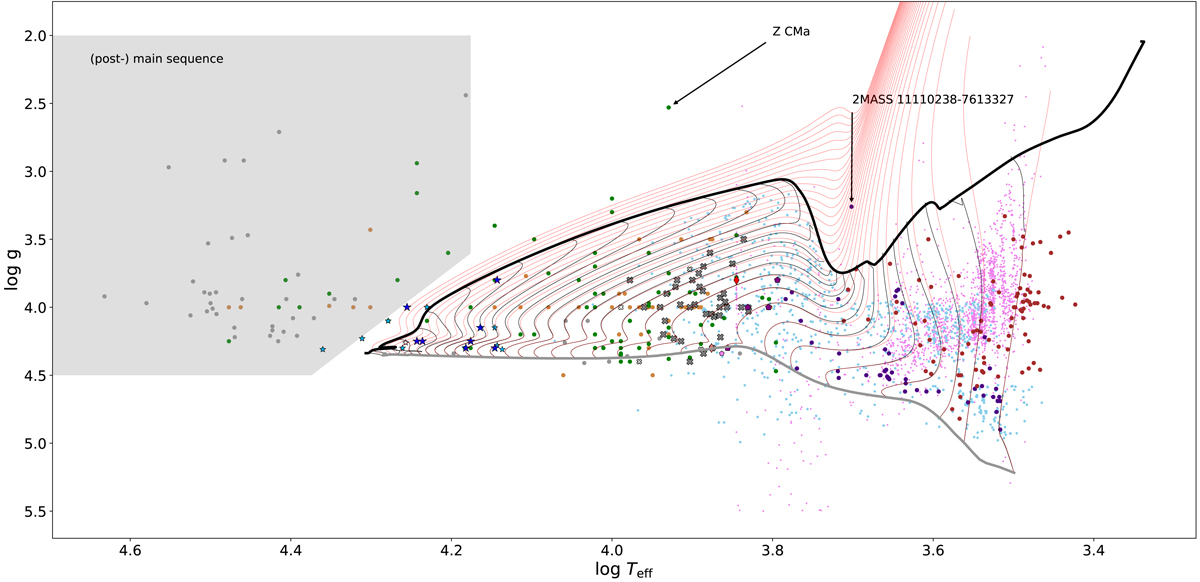
Download original image
Comparison of the accreting evolutionary tracks from protostars to the classical pre-main-sequence evolution. The thick black line shows our accreting standard model and the thin black line the pre-main-sequence models evolved from this accreting model. Red lines show classical pre-man sequence tracks with the same masses at the ZAMS as the pre-main-sequence models from the accretion protostar The ZAMS is shown as grey line. The grey shaded area at higher temperatures marks the position of (post-) main-sequence stars according to our interpretation. The colour code of the stars is the same as in Fig. 1.
Current usage metrics show cumulative count of Article Views (full-text article views including HTML views, PDF and ePub downloads, according to the available data) and Abstracts Views on Vision4Press platform.
Data correspond to usage on the plateform after 2015. The current usage metrics is available 48-96 hours after online publication and is updated daily on week days.
Initial download of the metrics may take a while.