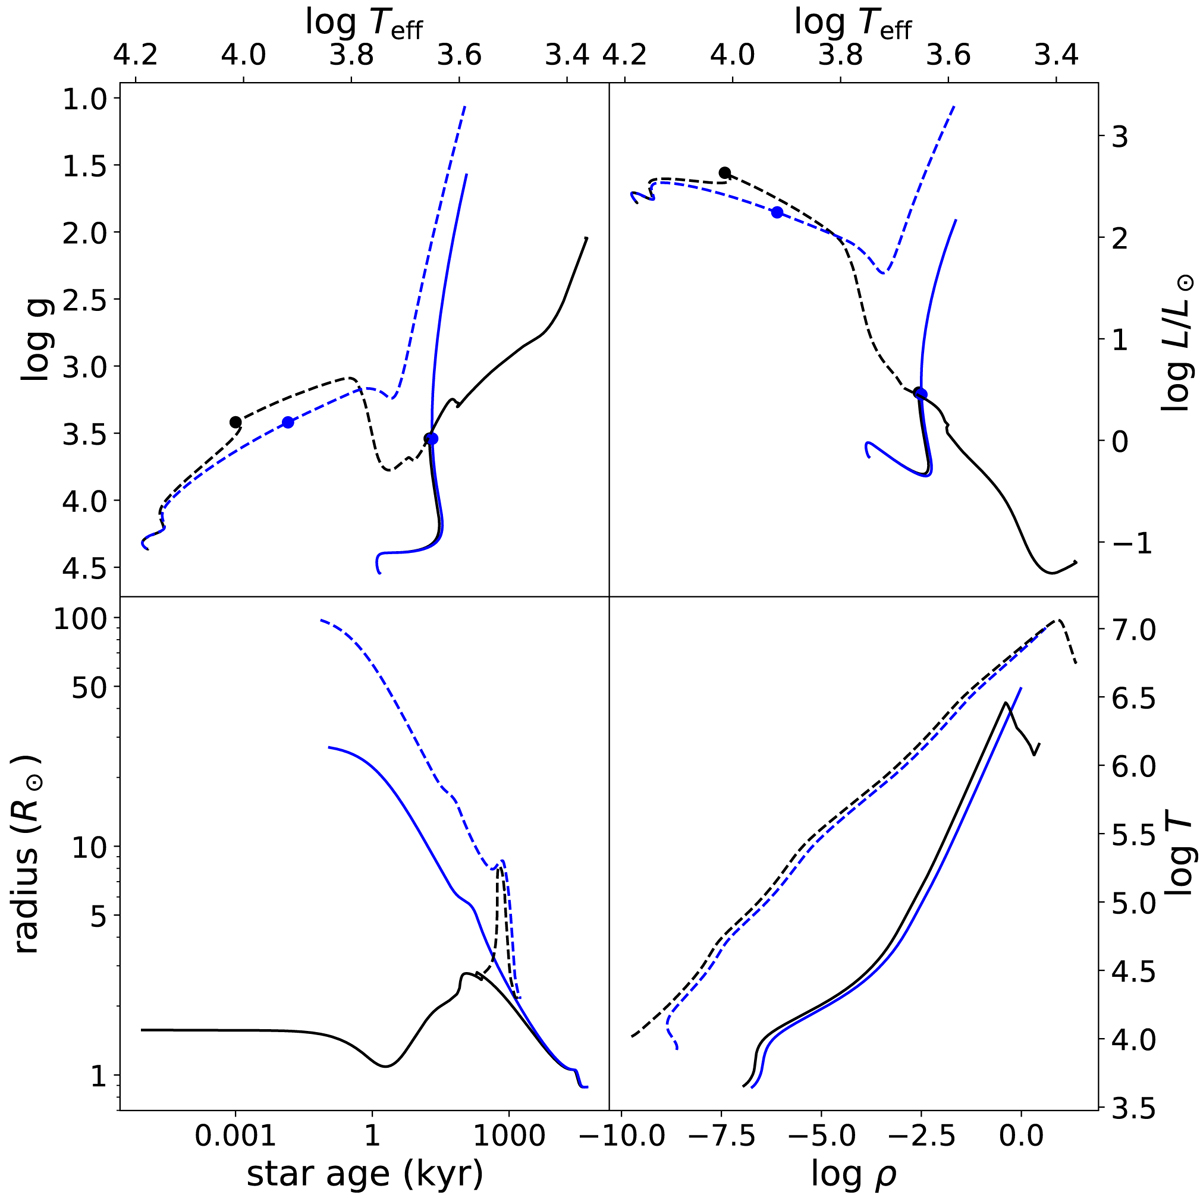
Fig. 8.
Download original image
Stellar models from accreting protostars compared to classical models. Black lines show the models originating from the accreting initial model, while blue lines show the evolution from classical initial models. The full lines correspond to a one solar mass model while the dashed lines correspond to a four solar mass model. Top left panel: Kiel diagram. Top right panel: Hertzprung-Russel diagram, where L is the photospheric luminosity. Bottom left panel: time evolution of the stellar radius. Bottom right: temperature – density (cgs units) profiles of selected models which are marked with a circle in the Kiel and Hertzsprung-Russel diagrams.
Current usage metrics show cumulative count of Article Views (full-text article views including HTML views, PDF and ePub downloads, according to the available data) and Abstracts Views on Vision4Press platform.
Data correspond to usage on the plateform after 2015. The current usage metrics is available 48-96 hours after online publication and is updated daily on week days.
Initial download of the metrics may take a while.