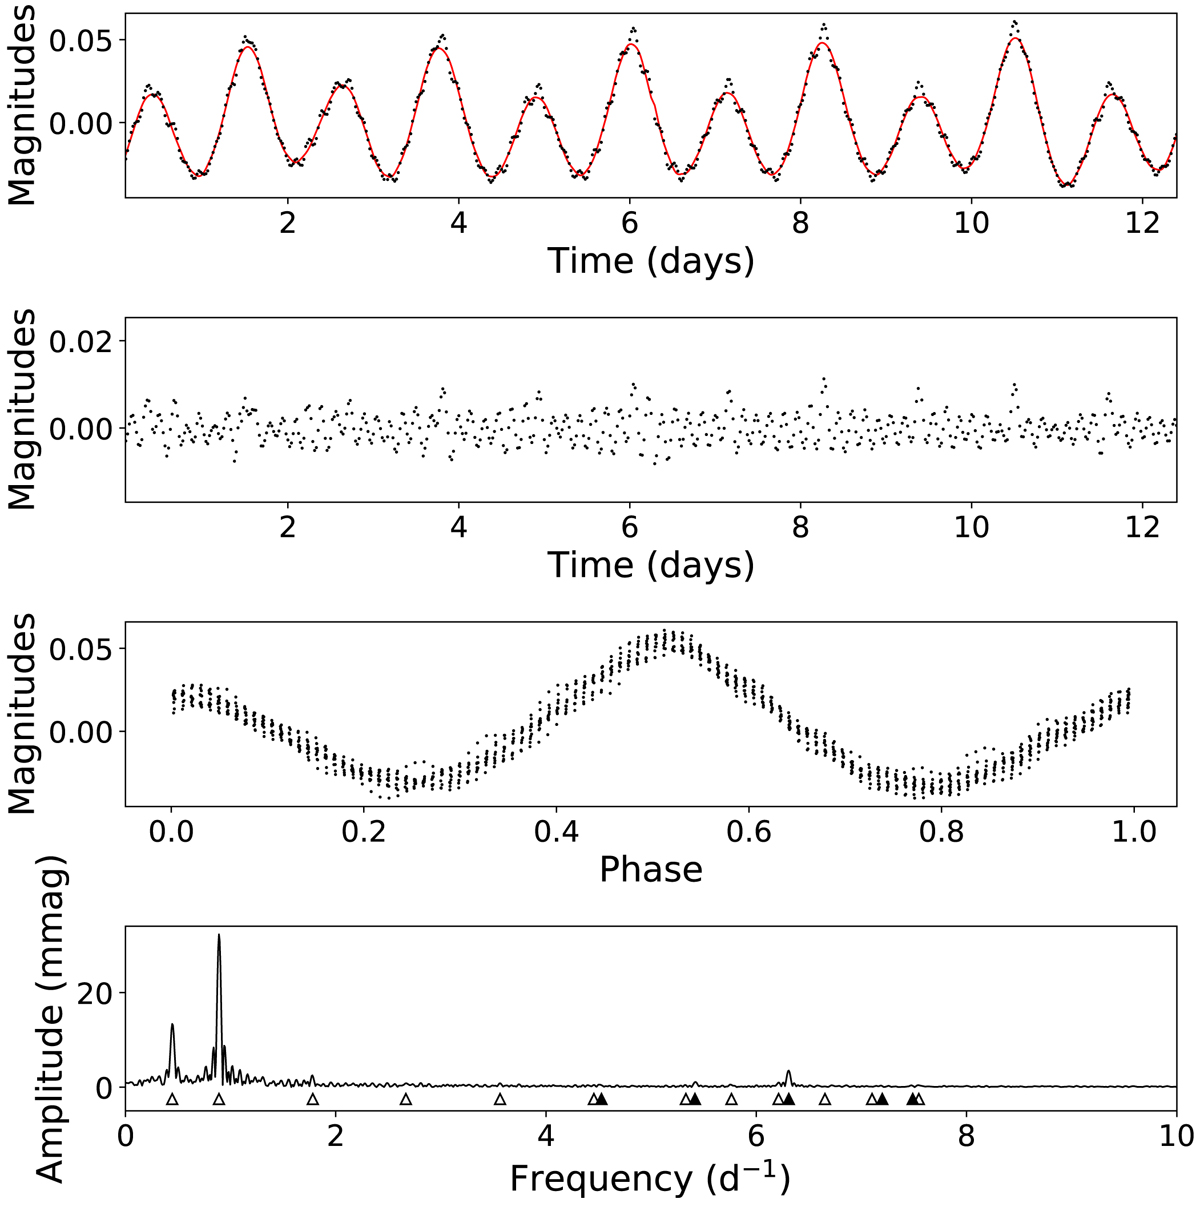
Fig. A.18.
Download original image
TESS observation of HD 329379. The top panel shows the first orbit of the TESS observation (black dots) and a simple model for the binary light curve (red line). The second panel shows the residual of the top panel. The third panel shows the folded TESS light curve. The bottom panel shows the amplitude spectrum (black line). Significant frequencies are marked as open triangles for multiples of the orbital frequency and filled triangles otherwise.
Current usage metrics show cumulative count of Article Views (full-text article views including HTML views, PDF and ePub downloads, according to the available data) and Abstracts Views on Vision4Press platform.
Data correspond to usage on the plateform after 2015. The current usage metrics is available 48-96 hours after online publication and is updated daily on week days.
Initial download of the metrics may take a while.