Free Access
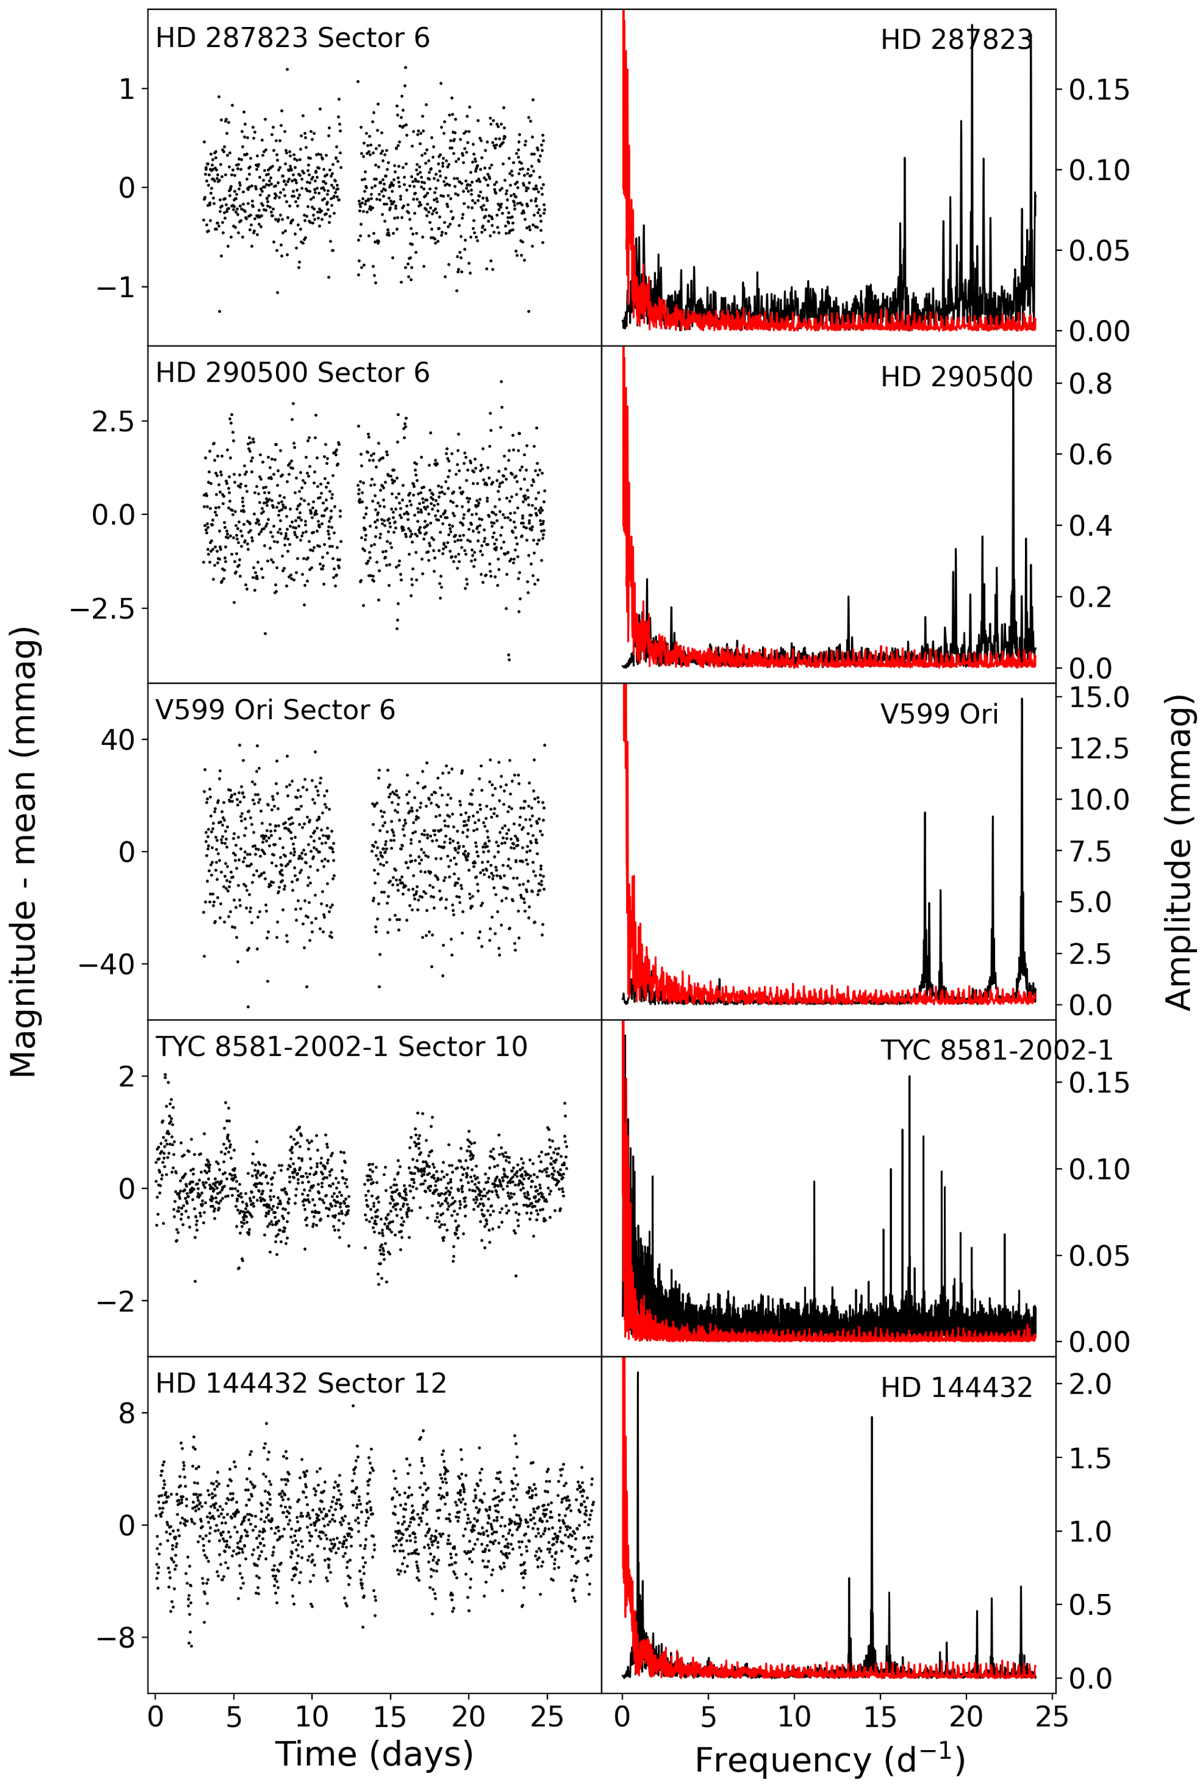
Fig. A.1.
Download original image
TESS Observations of the newly discovered δ Scuti stars. This is the same plot as Fig. 4 but including the spectral window (red line) of the light curves in the right panels. The spectral window is normalised to the highest peak in the amplitude spectrum and magnified by a factor of 100.
Current usage metrics show cumulative count of Article Views (full-text article views including HTML views, PDF and ePub downloads, according to the available data) and Abstracts Views on Vision4Press platform.
Data correspond to usage on the plateform after 2015. The current usage metrics is available 48-96 hours after online publication and is updated daily on week days.
Initial download of the metrics may take a while.