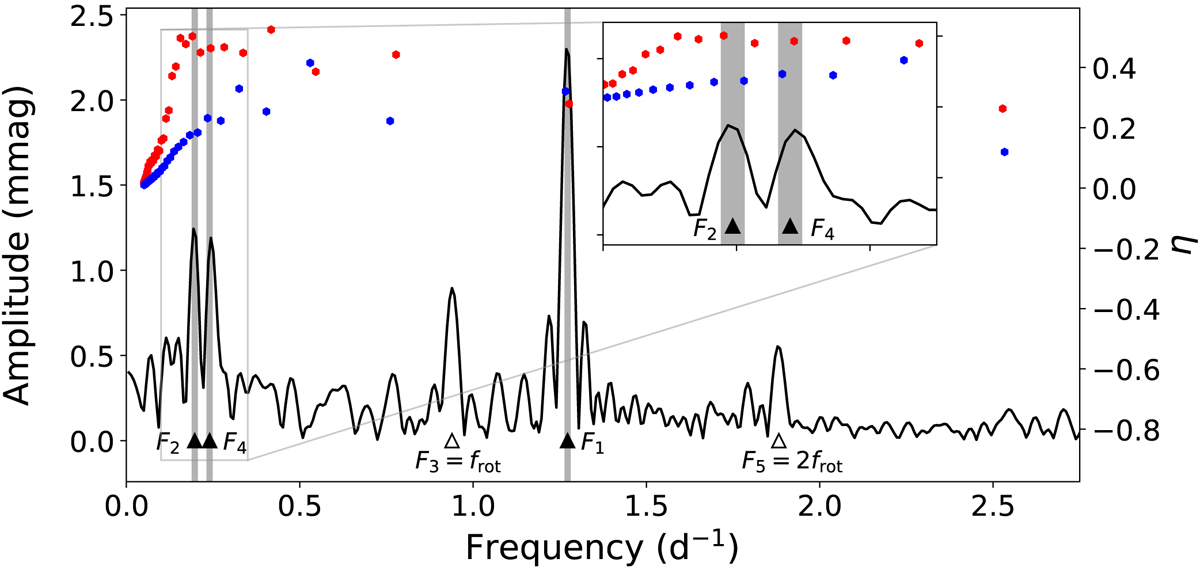
Fig. 17.
Download original image
Amplitude spectra and excited frequencies of models A and models B (see Table 4). Observed frequencies are marked with triangles at the bottom and the frequencies attributed to pulsations are covered in a gray shaded area with the size of a fourth of the Rayleigh limit. Open triangles mark frequencies attributed to rotation. The excited frequencies of two chosen models are shown as red and blue hexagons. The inset shows a zoom in in the low frequency region of F2 and F4.
Current usage metrics show cumulative count of Article Views (full-text article views including HTML views, PDF and ePub downloads, according to the available data) and Abstracts Views on Vision4Press platform.
Data correspond to usage on the plateform after 2015. The current usage metrics is available 48-96 hours after online publication and is updated daily on week days.
Initial download of the metrics may take a while.