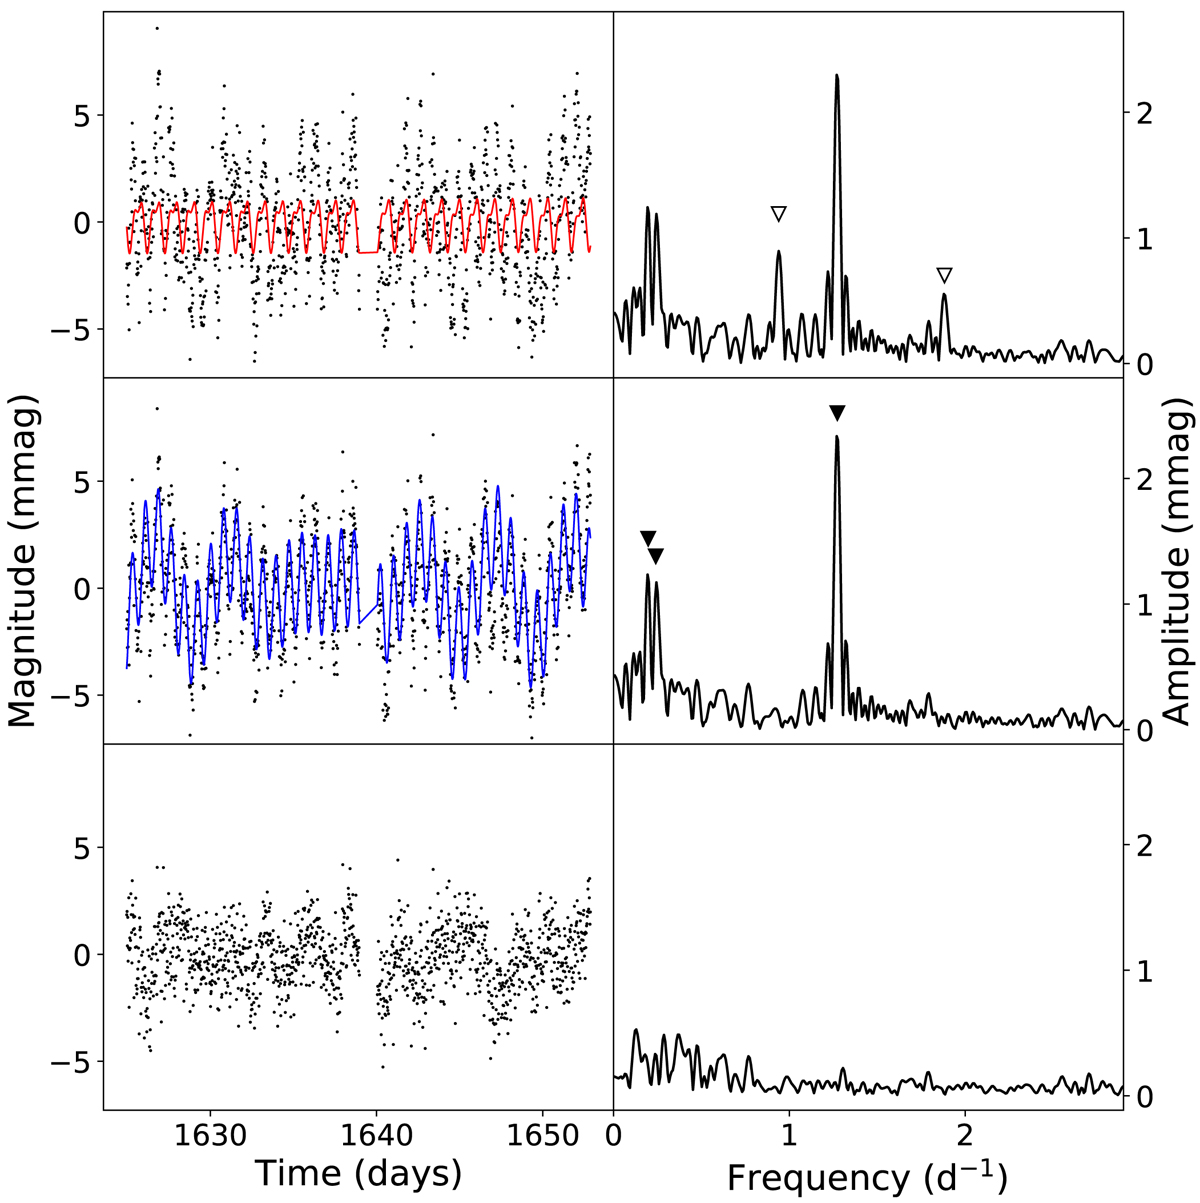
Fig. 16.
Download original image
Light curve and amplitude spectra of 2MASS J11120327-7637034. Left panels: corresponding light curve (black points) and a model (coloured lines), while right panels: corresponding amplitude spectra. The frequencies used in the model are marked with a filled (pulsation) or open (rotation) triangle. Top panel: TESS light curve and the model for rotational variability (red line) calculated from F3 and F5. Middle panel: TESS light curve after removing the rotational signal. Also shown is the pulsation model (blue line) calculated from F1, F3, and F4. Bottom panel: residuals after subtracting all five frequencies.
Current usage metrics show cumulative count of Article Views (full-text article views including HTML views, PDF and ePub downloads, according to the available data) and Abstracts Views on Vision4Press platform.
Data correspond to usage on the plateform after 2015. The current usage metrics is available 48-96 hours after online publication and is updated daily on week days.
Initial download of the metrics may take a while.