Fig. 14.
Download original image
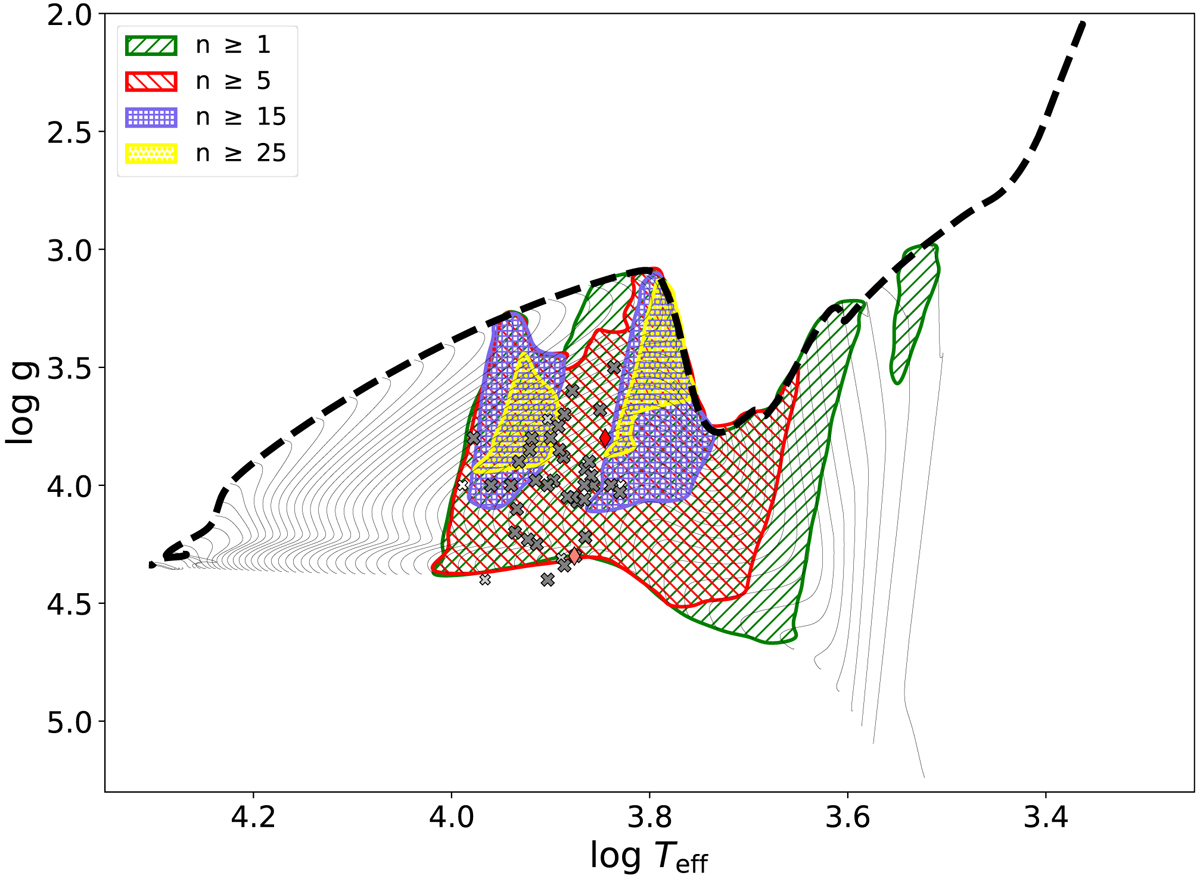
P-mode instability regions dependent on the excited orders. The black lines show the accreting evolutionary track (dashed) and the pre-main-sequence evolution from this models (thin). Different coloured areas show the regions where modes with radial orders higher than n ≥ 1, 5, 15, and 25 are unstable. The colour code of the shown pulsators is the same as in Fig. 1.
Current usage metrics show cumulative count of Article Views (full-text article views including HTML views, PDF and ePub downloads, according to the available data) and Abstracts Views on Vision4Press platform.
Data correspond to usage on the plateform after 2015. The current usage metrics is available 48-96 hours after online publication and is updated daily on week days.
Initial download of the metrics may take a while.