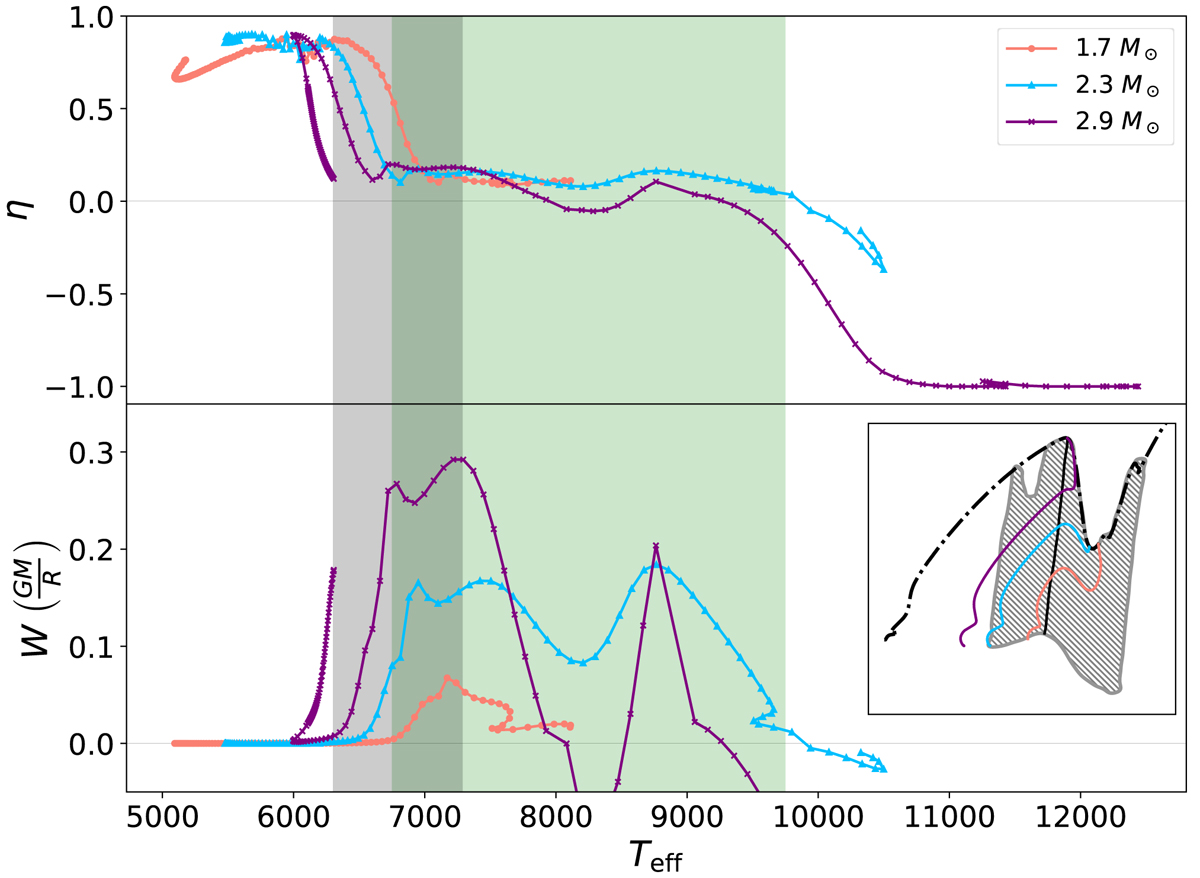
Fig. 12.
Download original image
Pulsation parameters for the pressure mode of radial order n = 4 for selected models. Upper panel: normalised growth rate. Lower panel: work performed by one pulsation cycle. The inset in the lower panel shows the Kiel diagram of the three corresponding evolutionary tracks (coloured lines) and the accreting evolutionary track (black dash dotted line). Also shown is the p-mode instability region for any modes (gray area) and the boundary for high η as in Fig. 11. The upper and lower panel also include the temperature ranges of the boundary (grey area) and the effective temperatures of observed pre-main sequence stars (green area) which overlap.
Current usage metrics show cumulative count of Article Views (full-text article views including HTML views, PDF and ePub downloads, according to the available data) and Abstracts Views on Vision4Press platform.
Data correspond to usage on the plateform after 2015. The current usage metrics is available 48-96 hours after online publication and is updated daily on week days.
Initial download of the metrics may take a while.