Fig. 11.
Download original image
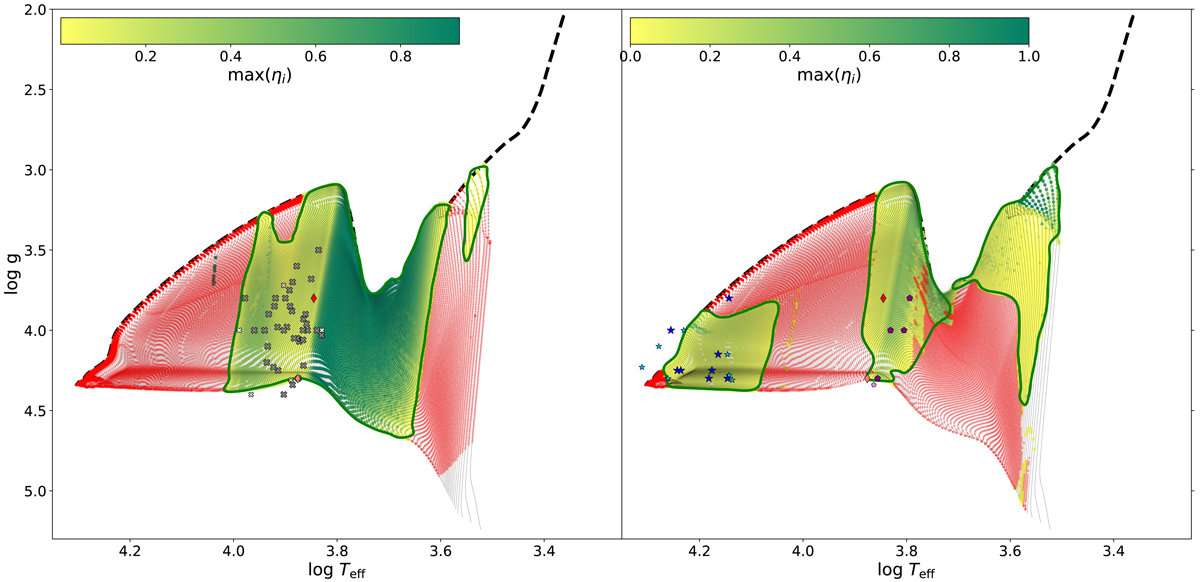
Pre-main-sequence instability regions from normalised growth rates. The black dotted line is our final accretion model. Thin black lines show the pre-main seqeunce tracks for different masses from the accreting evolutationary track to the ZAMS. The colour code for green dots shows the maximum of the normalised growth rate of a given model and, hence, the instability strips. Models without unstable modes are shown as red dots. The green line follows the borders of the instability region resulting from our calculations. Left panel: p-modes. Right panel: g-modes. The colour code of the shown pulsators is the same as in Fig. 1.
Current usage metrics show cumulative count of Article Views (full-text article views including HTML views, PDF and ePub downloads, according to the available data) and Abstracts Views on Vision4Press platform.
Data correspond to usage on the plateform after 2015. The current usage metrics is available 48-96 hours after online publication and is updated daily on week days.
Initial download of the metrics may take a while.