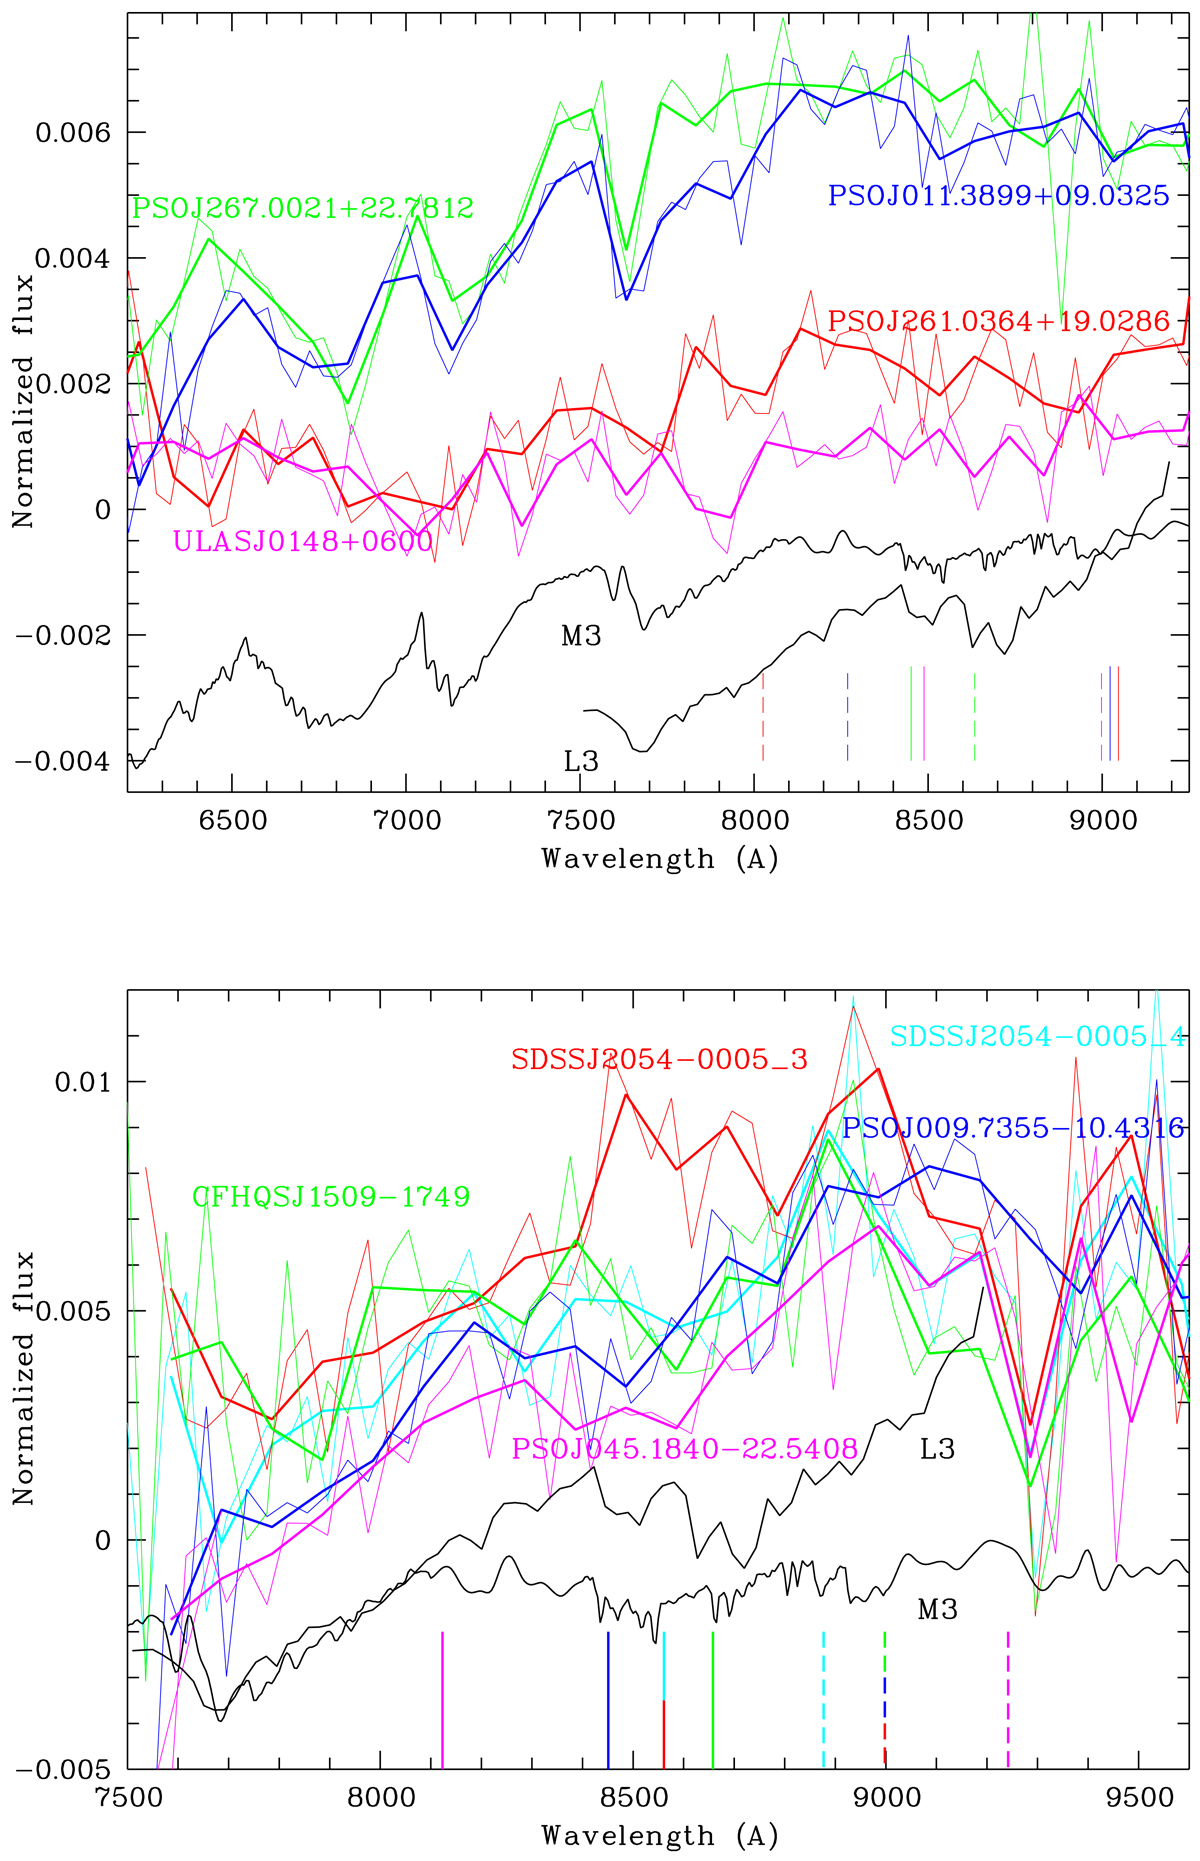
Fig. 7.
Download original image
Long-slit spectra binned at 160 and 400 Å (thin and thick lines, respectively) obtained with the GMOS spectrographs at the Gemini North (top panel) and South (lower panel) Observatories. The vertical solid lines denote the position of Ly-α of its ‘mother’ QSO, the vertical dashed line the position of Ly-α based on the Le PHARE fits. The dwarf templates are at arbitrary normalizations.
Current usage metrics show cumulative count of Article Views (full-text article views including HTML views, PDF and ePub downloads, according to the available data) and Abstracts Views on Vision4Press platform.
Data correspond to usage on the plateform after 2015. The current usage metrics is available 48-96 hours after online publication and is updated daily on week days.
Initial download of the metrics may take a while.