Fig. 5.
Download original image
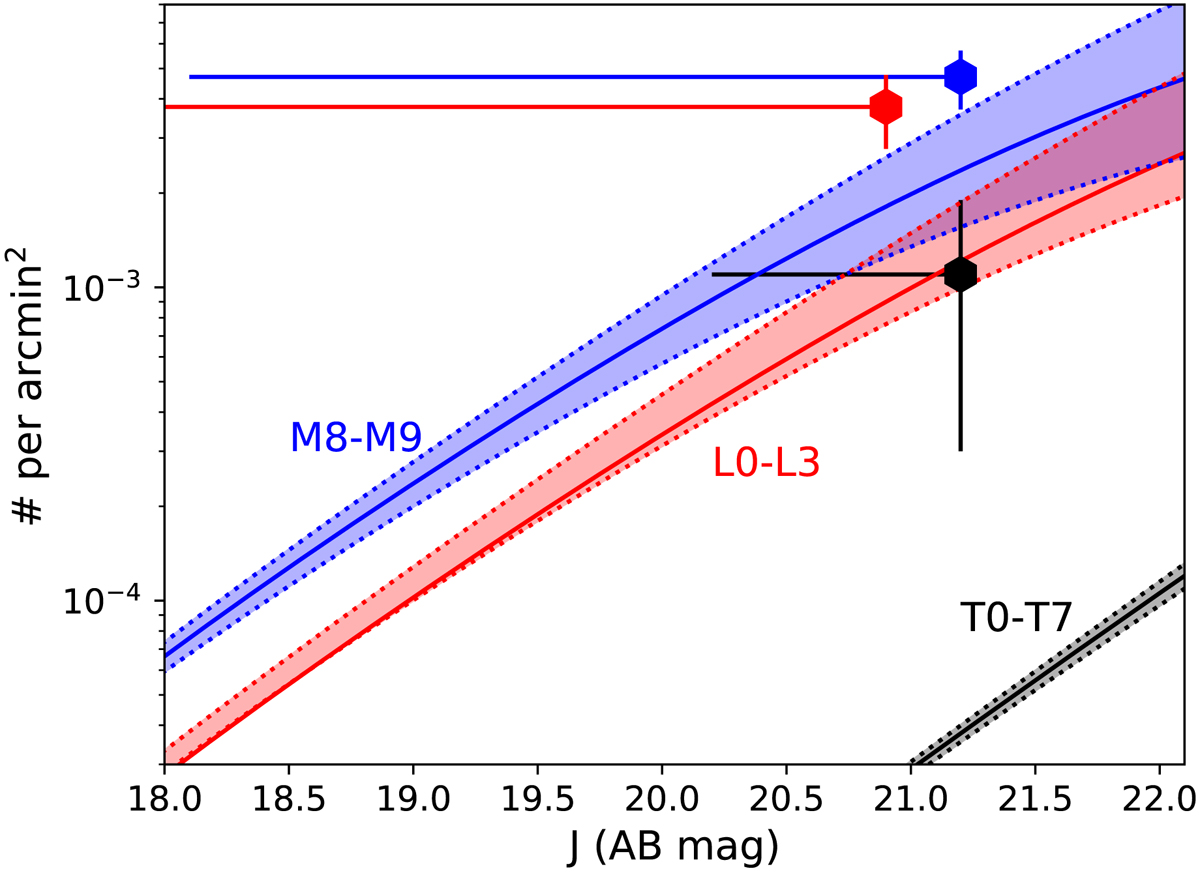
Number of brown dwarfs among our sample of 26 candidates per total area of our search region over 116 QSOs, compared to the cumulative surface density as modelled by Ryan & Reid (2016), plotted here for their COSMOS sample field (central line) as well as the fields with the smallest and largest numbers (corresponding to different galactic latitudes) providing the covered range (shaded area). Our data points are plotted at the faintest magnitude per spectral type range, and the horizontal bar covers the magnitude range up to the brightest. While the observed number of M dwarfs is compatible with the known surface density, that of T dwarfs is substantially larger.
Current usage metrics show cumulative count of Article Views (full-text article views including HTML views, PDF and ePub downloads, according to the available data) and Abstracts Views on Vision4Press platform.
Data correspond to usage on the plateform after 2015. The current usage metrics is available 48-96 hours after online publication and is updated daily on week days.
Initial download of the metrics may take a while.