Fig. 9.
Download original image
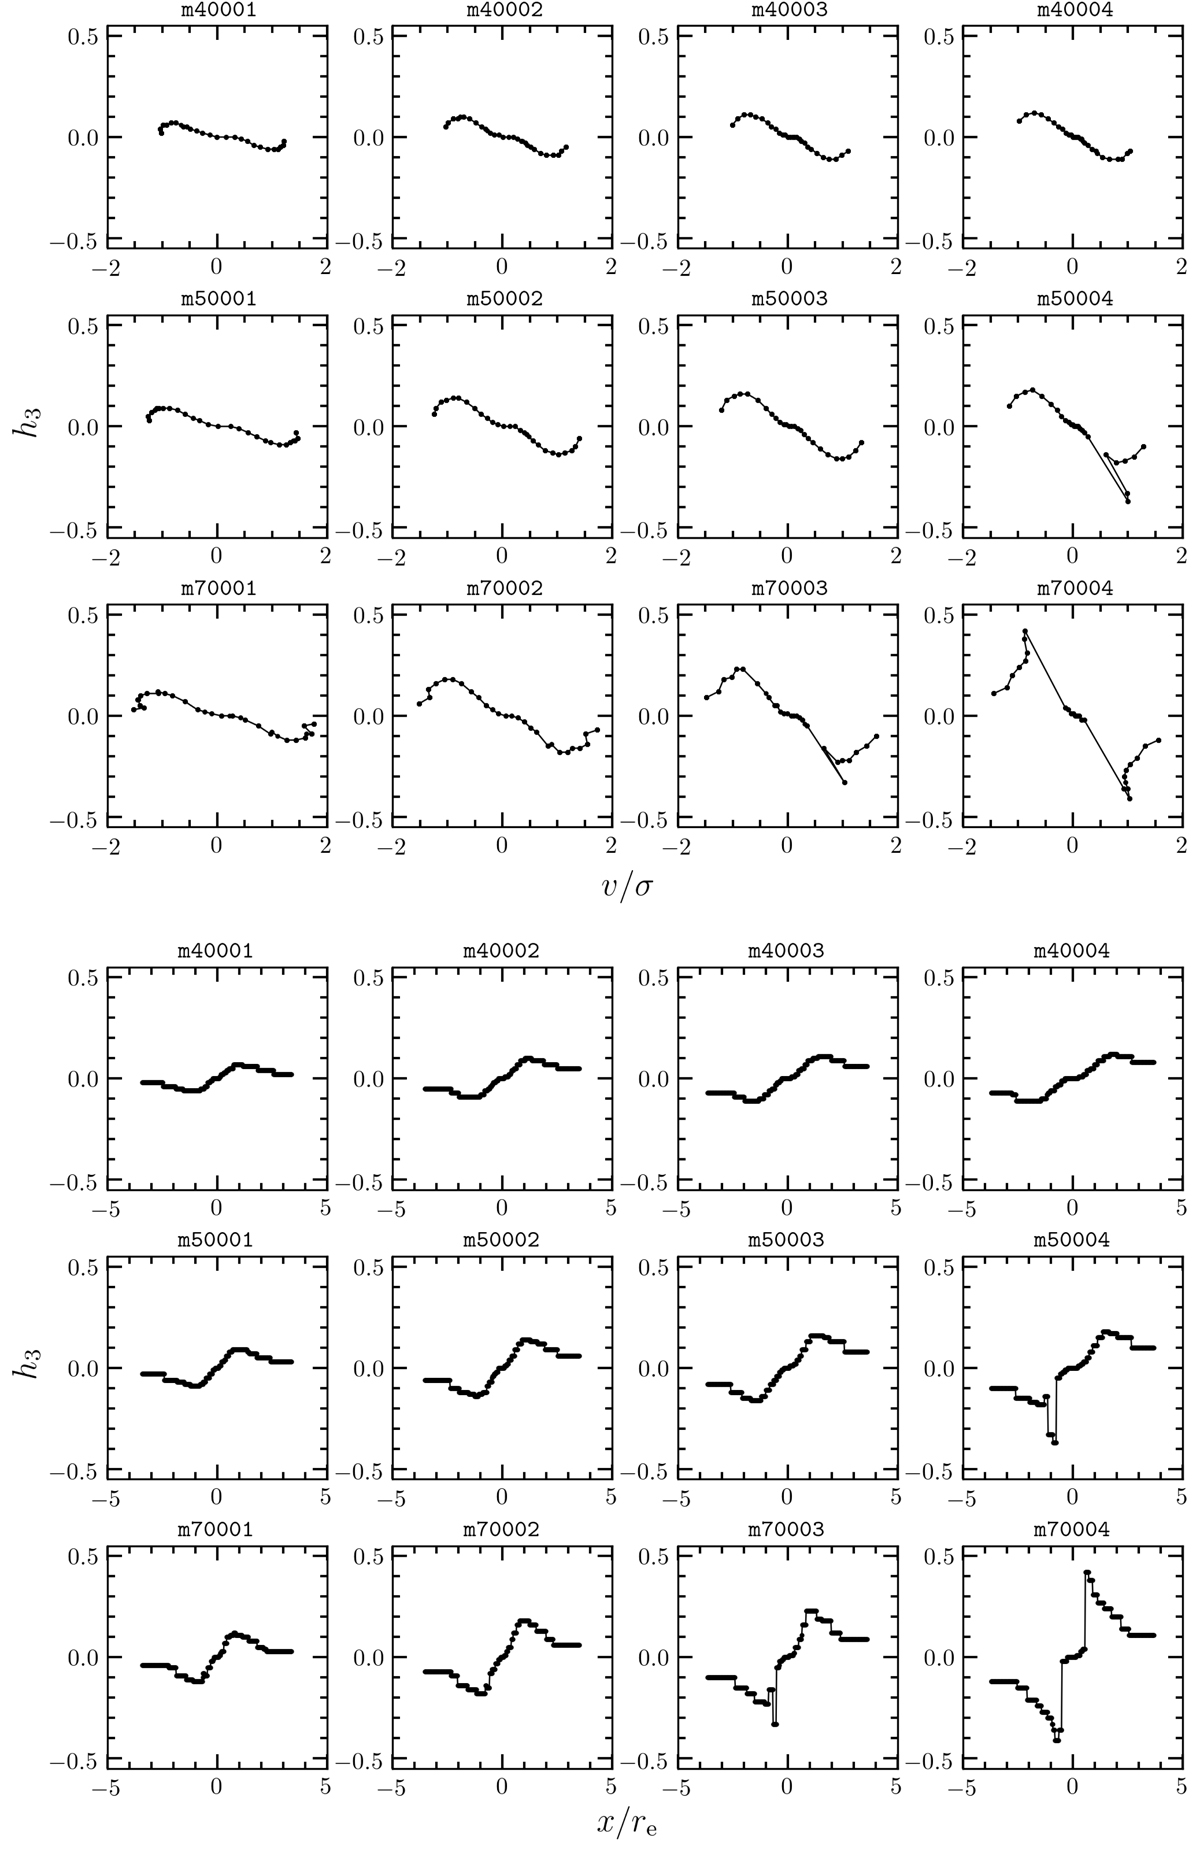
Local correlation of h3 − v/σ (top panels) and radial trend of h3 as function of x/re (bottom panels) for the first four models of subset 1 (from left to right) with inclination i = 40°, 50°, and 70° (from top to bottom, respectively). The filled circles are the data points that are connected through a solid line to better illustrate the trend.
Current usage metrics show cumulative count of Article Views (full-text article views including HTML views, PDF and ePub downloads, according to the available data) and Abstracts Views on Vision4Press platform.
Data correspond to usage on the plateform after 2015. The current usage metrics is available 48-96 hours after online publication and is updated daily on week days.
Initial download of the metrics may take a while.