Fig. 3.
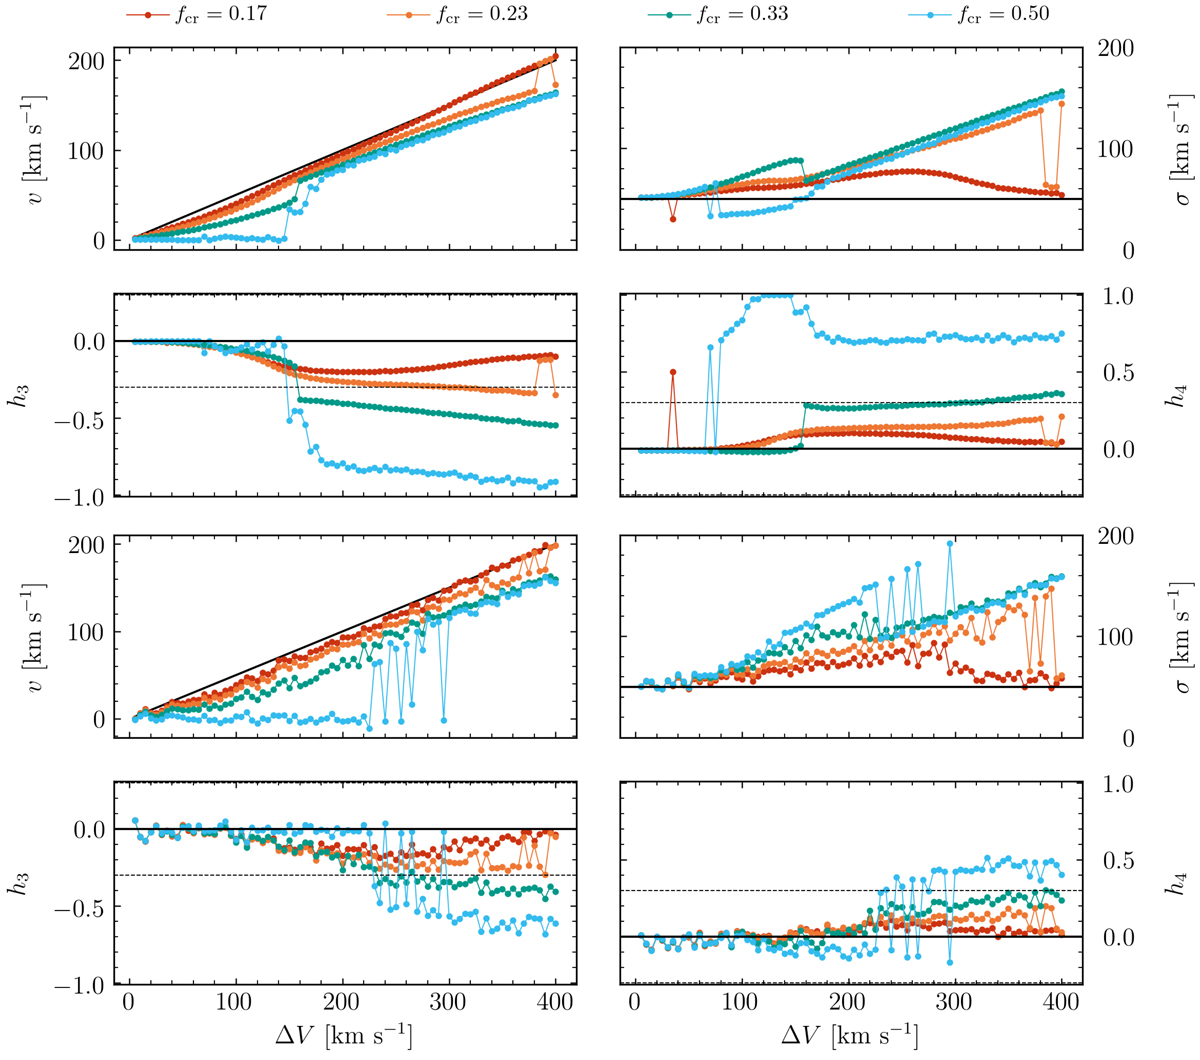
Download original image
Comparison of the recovered stellar kinematic parameters in the case of mock spectra without noise (top four panels) and with S/N = 50 pixel−1 (bottom four panels). In both cases the mean velocity v (upper left panel), velocity dispersion σ (upper right panel), and higher-order moments h3 (bottom left panel) and h4 (bottom right panel) of the LOSVD of two counter-rotating components are known as a function of their input velocity separation ΔV. The points correspond to the measured values for mock spectra with fcr = 0.17 (red), 0.23 (orange), 0.33 (light-blue), and 0.50 (black), respectively. The points are connected to highlight the trend. The black solid lines indicate the input value of the mean velocity (v = Vpro), velocity dispersion (σ = σpro), and h3 = h4 = 0 as a function of ΔV. The black dashed lines indicate the default limits to the higher-order moments.
Current usage metrics show cumulative count of Article Views (full-text article views including HTML views, PDF and ePub downloads, according to the available data) and Abstracts Views on Vision4Press platform.
Data correspond to usage on the plateform after 2015. The current usage metrics is available 48-96 hours after online publication and is updated daily on week days.
Initial download of the metrics may take a while.