Fig. 11.
Download original image
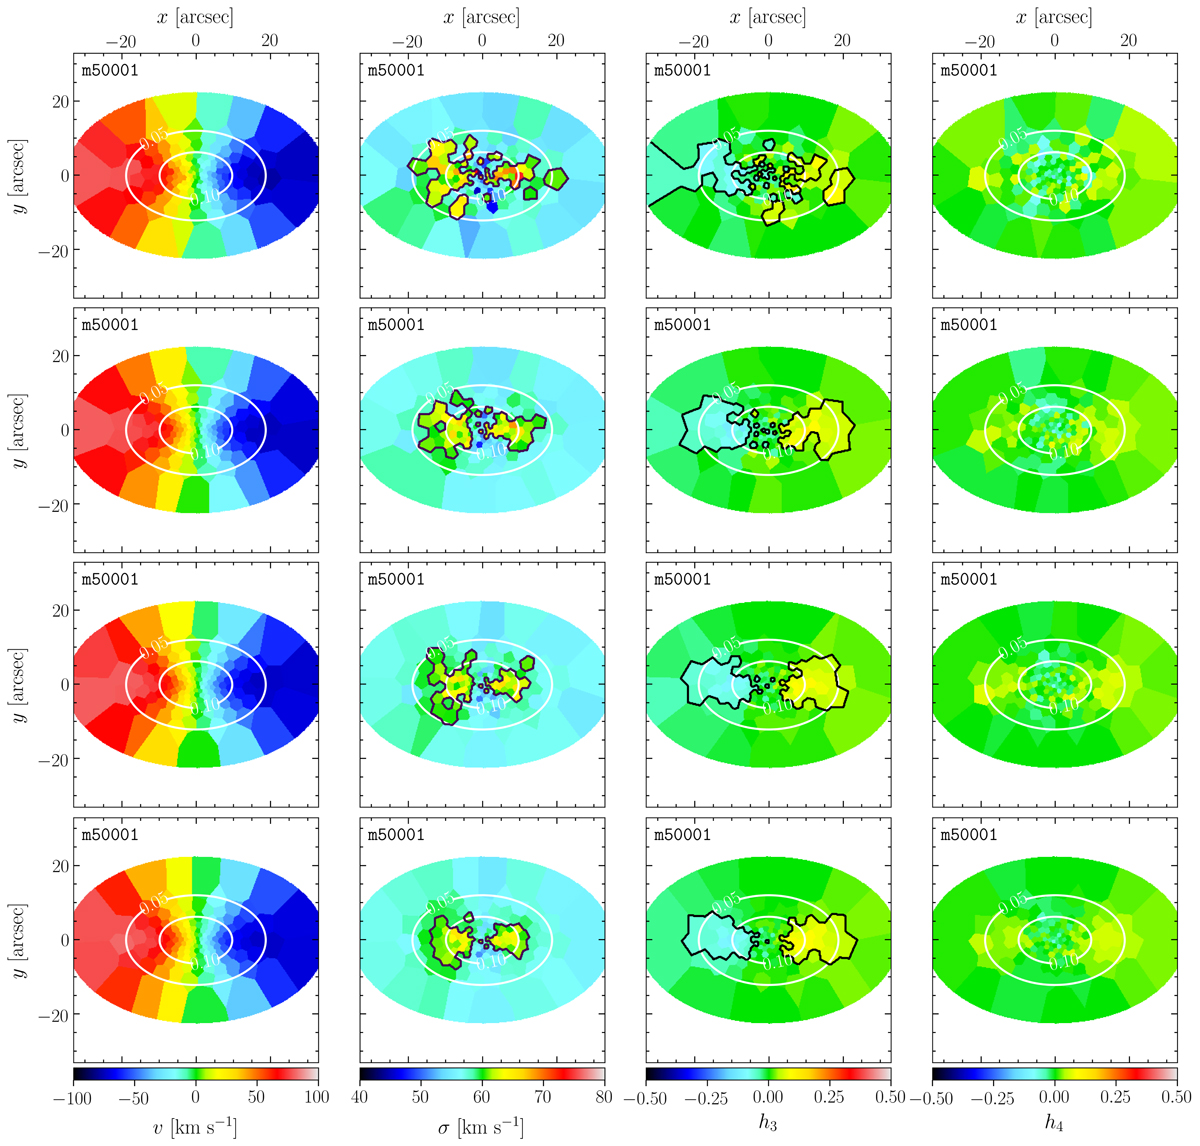
Stellar kinematic maps of v, σ, h3, and h4 (from left to right) of the LOSVD for the model m50001 derived from data with S/N = 5, 10, 15, 20 pixel−1 (from top to bottom). The inner and outer dotted ellipses show where fcr = 0.10 and 0.05, respectively. The solid contours in the σ and h3 maps correspond to σ = 60 km s−1 and |h3| = 0.05, respectively.
Current usage metrics show cumulative count of Article Views (full-text article views including HTML views, PDF and ePub downloads, according to the available data) and Abstracts Views on Vision4Press platform.
Data correspond to usage on the plateform after 2015. The current usage metrics is available 48-96 hours after online publication and is updated daily on week days.
Initial download of the metrics may take a while.