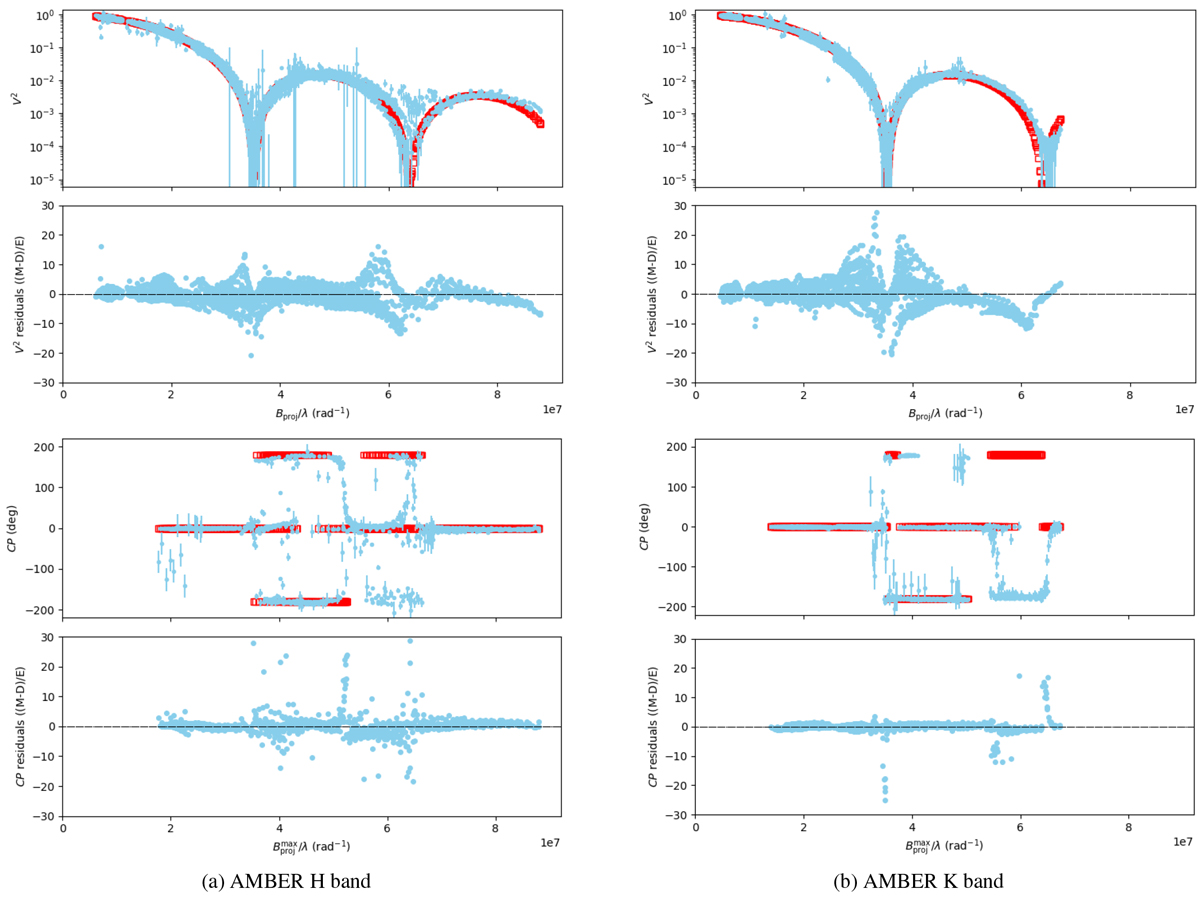
Fig. C.1
Download original image
Canopus calibrated squared visibilities, V2 (log scale), closure phases, CP, and errors as a function of the spatial frequency, observed with AMBER/VLTI (light blue) in the H (a) and K (b) bands. The red squares correspond to the best-fit-model observables obtained from an MCMC fit on the AMBER data using a power-law LD and including bandwidth smearing. The residuals of the fit are also shown.
Current usage metrics show cumulative count of Article Views (full-text article views including HTML views, PDF and ePub downloads, according to the available data) and Abstracts Views on Vision4Press platform.
Data correspond to usage on the plateform after 2015. The current usage metrics is available 48-96 hours after online publication and is updated daily on week days.
Initial download of the metrics may take a while.