Fig. 6
Download original image
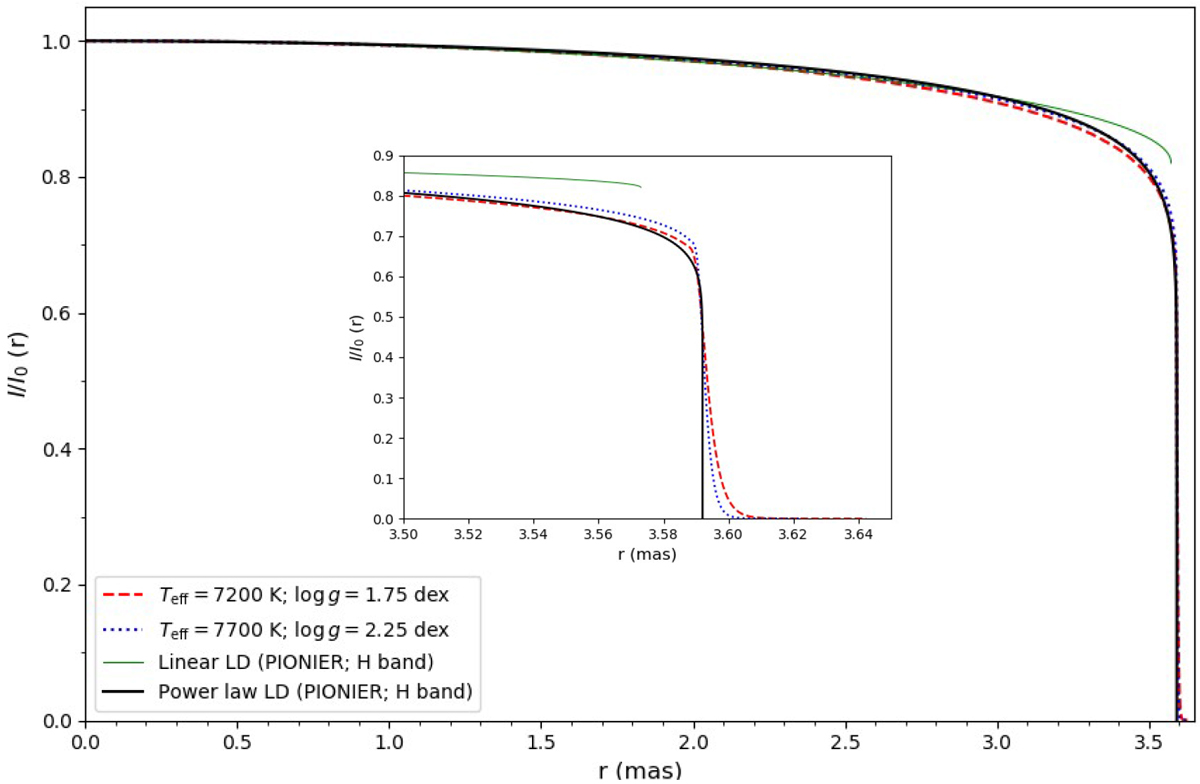
Comparison between measured and modeled normalized intensity profiles, I(r)∕I(r = 0), as a functionof the angular radius r (from 0 to 0.5⊘H). The interferometrically measured profiles are shown in plain lines for the linear (green) and power-law (black) LD models, fitted to the PIONIER data (see Tables 2 and 3). The dashed red and dotted blue profiles correspond to selected SATLAS stellar atmosphere models computed in spherically symmetric geometry in the H band (Lester & Neilson 2008; Neilson & Lester 2013). The selected models correspond to a 10 M⊙ model, with Teff (blue) or log g (red) being closest to the measured values. The measured power-law LD and the SATLAS profiles show a general good agreement, even though they do not exactly match the measured Canopus parameters. A small discrepancy is mostly seen only very close (above 97%) to the stellar limb (see the zoomed-in plot in the inset). The precision of present interferometric data does not allow such tiny differences to be distinguished among these intensity profiles.
Current usage metrics show cumulative count of Article Views (full-text article views including HTML views, PDF and ePub downloads, according to the available data) and Abstracts Views on Vision4Press platform.
Data correspond to usage on the plateform after 2015. The current usage metrics is available 48-96 hours after online publication and is updated daily on week days.
Initial download of the metrics may take a while.