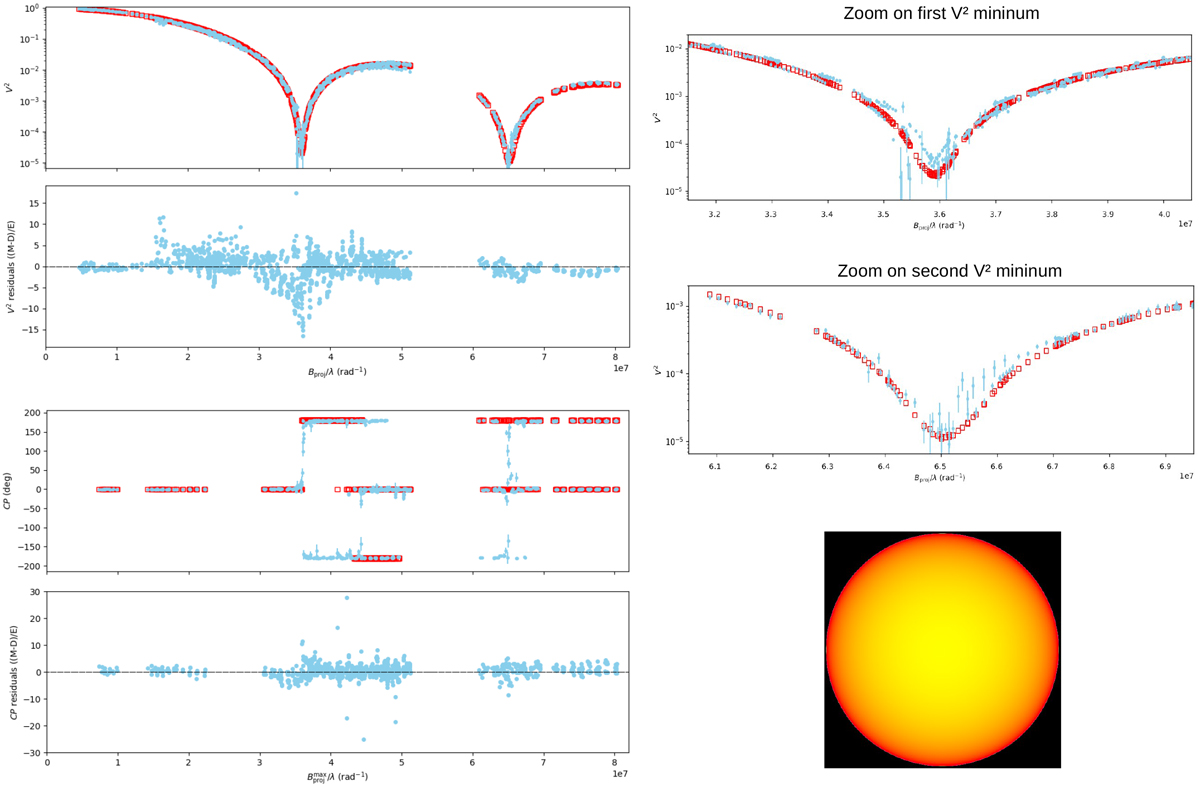
Fig. 3
Download original image
Canopus calibrated squared visibilities, V2 (log scale), closure phases, CP, and errors as a function of the spatial frequency, observed with VLTI/PIONIER (light blue). The red squares correspond to the best-fit-model observables obtained from an MCMC fit on the PIONIER data using a power-law LD and including bandwidth smearing. The residuals of the fit are also shown; the fit details and measured parameters are given in Sect. 2 and in Table 3. The two upper-right figures show a zoom-in on the first two V2 minima, both of which are well sampled by PIONIER. The bottom-right image illustrates Canopus as seen in the H band according to our best-fit power-law LD model.
Current usage metrics show cumulative count of Article Views (full-text article views including HTML views, PDF and ePub downloads, according to the available data) and Abstracts Views on Vision4Press platform.
Data correspond to usage on the plateform after 2015. The current usage metrics is available 48-96 hours after online publication and is updated daily on week days.
Initial download of the metrics may take a while.