Fig. 1
Download original image
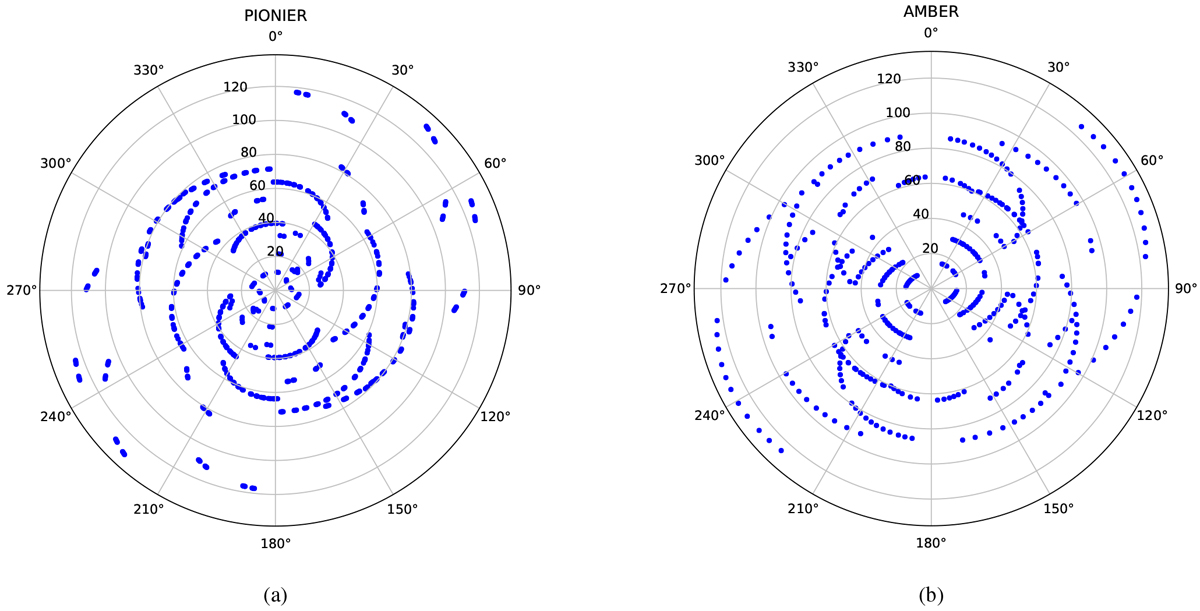
Fourier or uv-plane coverage for the VLTI observations of Canopus obtained with PIONIER (a) and AMBER (b) using different combinations of ATs. The plots are given in polar coordinates so that the values of the projected baseline lengths, Bp (circles, with values in meters), and position angles, PA (radial lines, given in degree), are explicitly indicated.
Current usage metrics show cumulative count of Article Views (full-text article views including HTML views, PDF and ePub downloads, according to the available data) and Abstracts Views on Vision4Press platform.
Data correspond to usage on the plateform after 2015. The current usage metrics is available 48-96 hours after online publication and is updated daily on week days.
Initial download of the metrics may take a while.