Fig. 7
Download original image
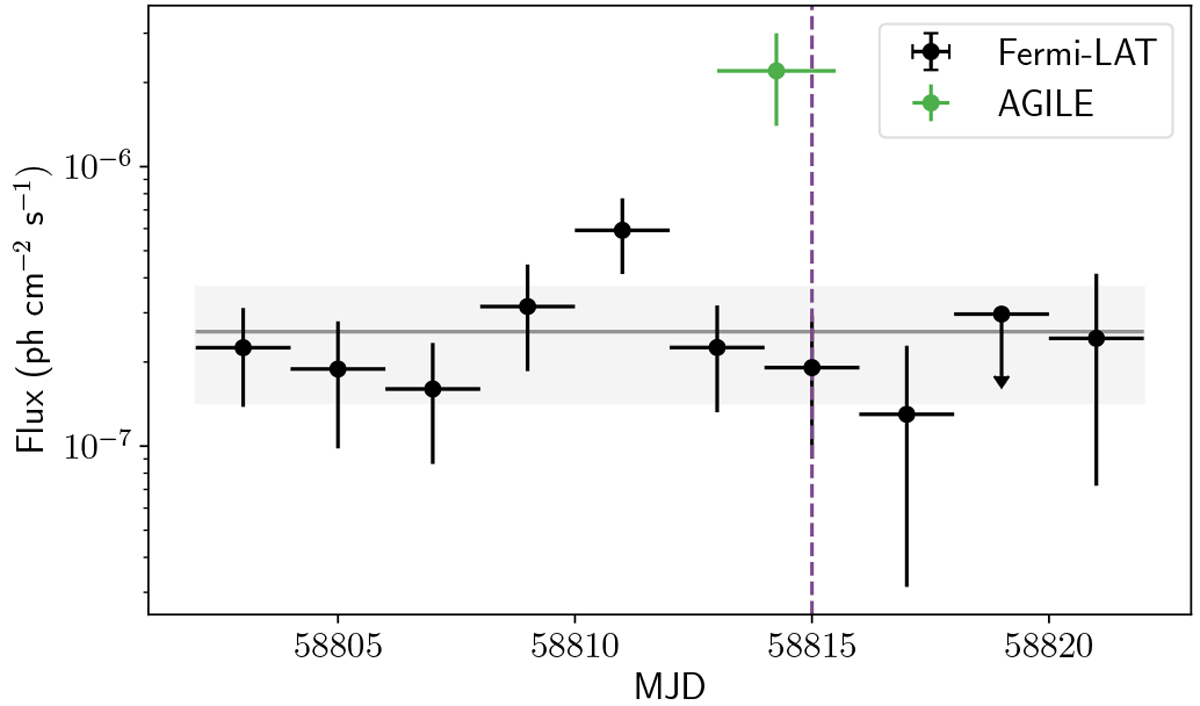
Light curve of η Carinae from 15 November to 5 December in 2019. In black, dedicated analysis between 100 MeV and 500 GeV with Fermi-LAT (2-day bins, requiring at least 2σ for detection). The corresponding average flux is represented with a grey line. The γ-ray flux enhancement reported by AGILE is shown in green (Piano et al. 2019), which overlaps with the X-ray light curve peak on 28 November 2019, indicated by a violet dashed-line (Corcoran et al. 2019).
Current usage metrics show cumulative count of Article Views (full-text article views including HTML views, PDF and ePub downloads, according to the available data) and Abstracts Views on Vision4Press platform.
Data correspond to usage on the plateform after 2015. The current usage metrics is available 48-96 hours after online publication and is updated daily on week days.
Initial download of the metrics may take a while.