Fig. 7.
Download original image
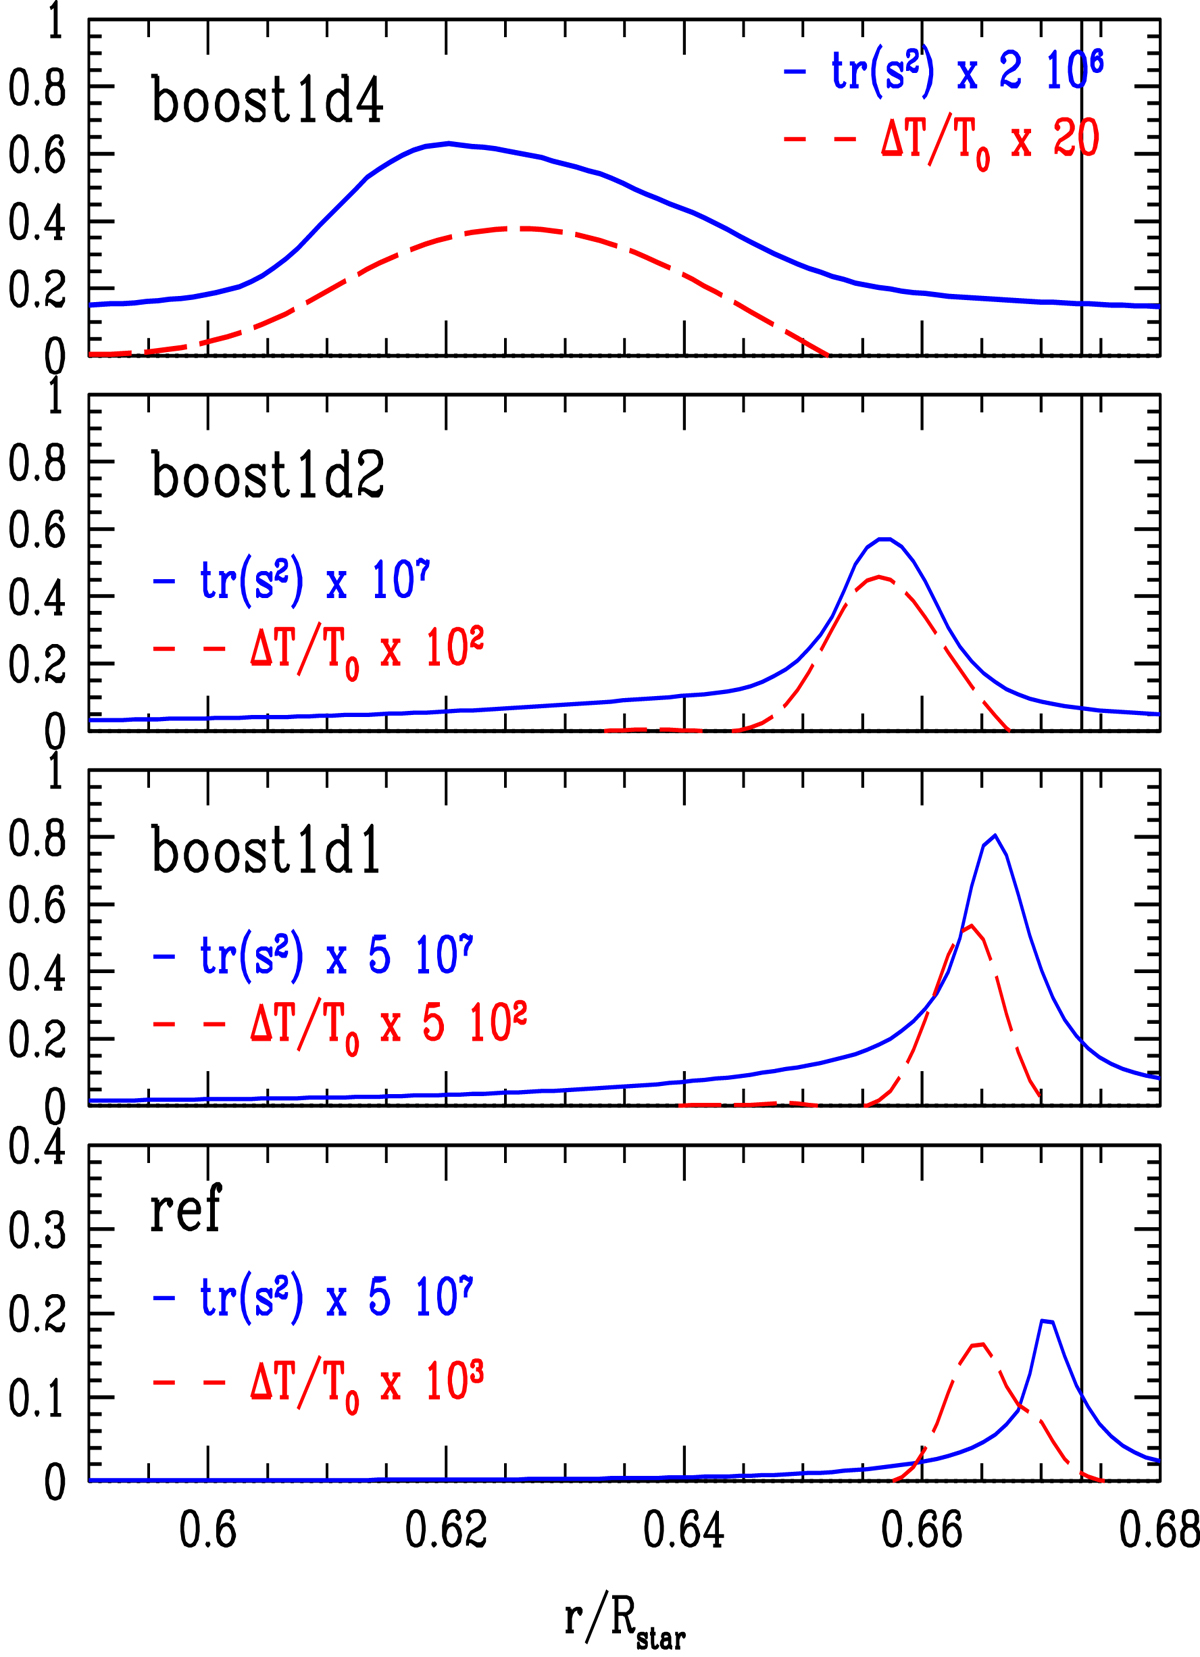
Radial profile of the time and space averages of the trace of s2, ![]() (solid blue lines) in the overshooting layer. The red dashed lines indicate the profile of the relative difference between the time/space average of the temperature ⟨⟨T⟩θ⟩t and the initial profile T0. The convective boundary corresponding to the Schwarzschild boundary from the 1D initial model is indicated by the vertical solid line.
(solid blue lines) in the overshooting layer. The red dashed lines indicate the profile of the relative difference between the time/space average of the temperature ⟨⟨T⟩θ⟩t and the initial profile T0. The convective boundary corresponding to the Schwarzschild boundary from the 1D initial model is indicated by the vertical solid line.
Current usage metrics show cumulative count of Article Views (full-text article views including HTML views, PDF and ePub downloads, according to the available data) and Abstracts Views on Vision4Press platform.
Data correspond to usage on the plateform after 2015. The current usage metrics is available 48-96 hours after online publication and is updated daily on week days.
Initial download of the metrics may take a while.