Fig. 6.
Download original image
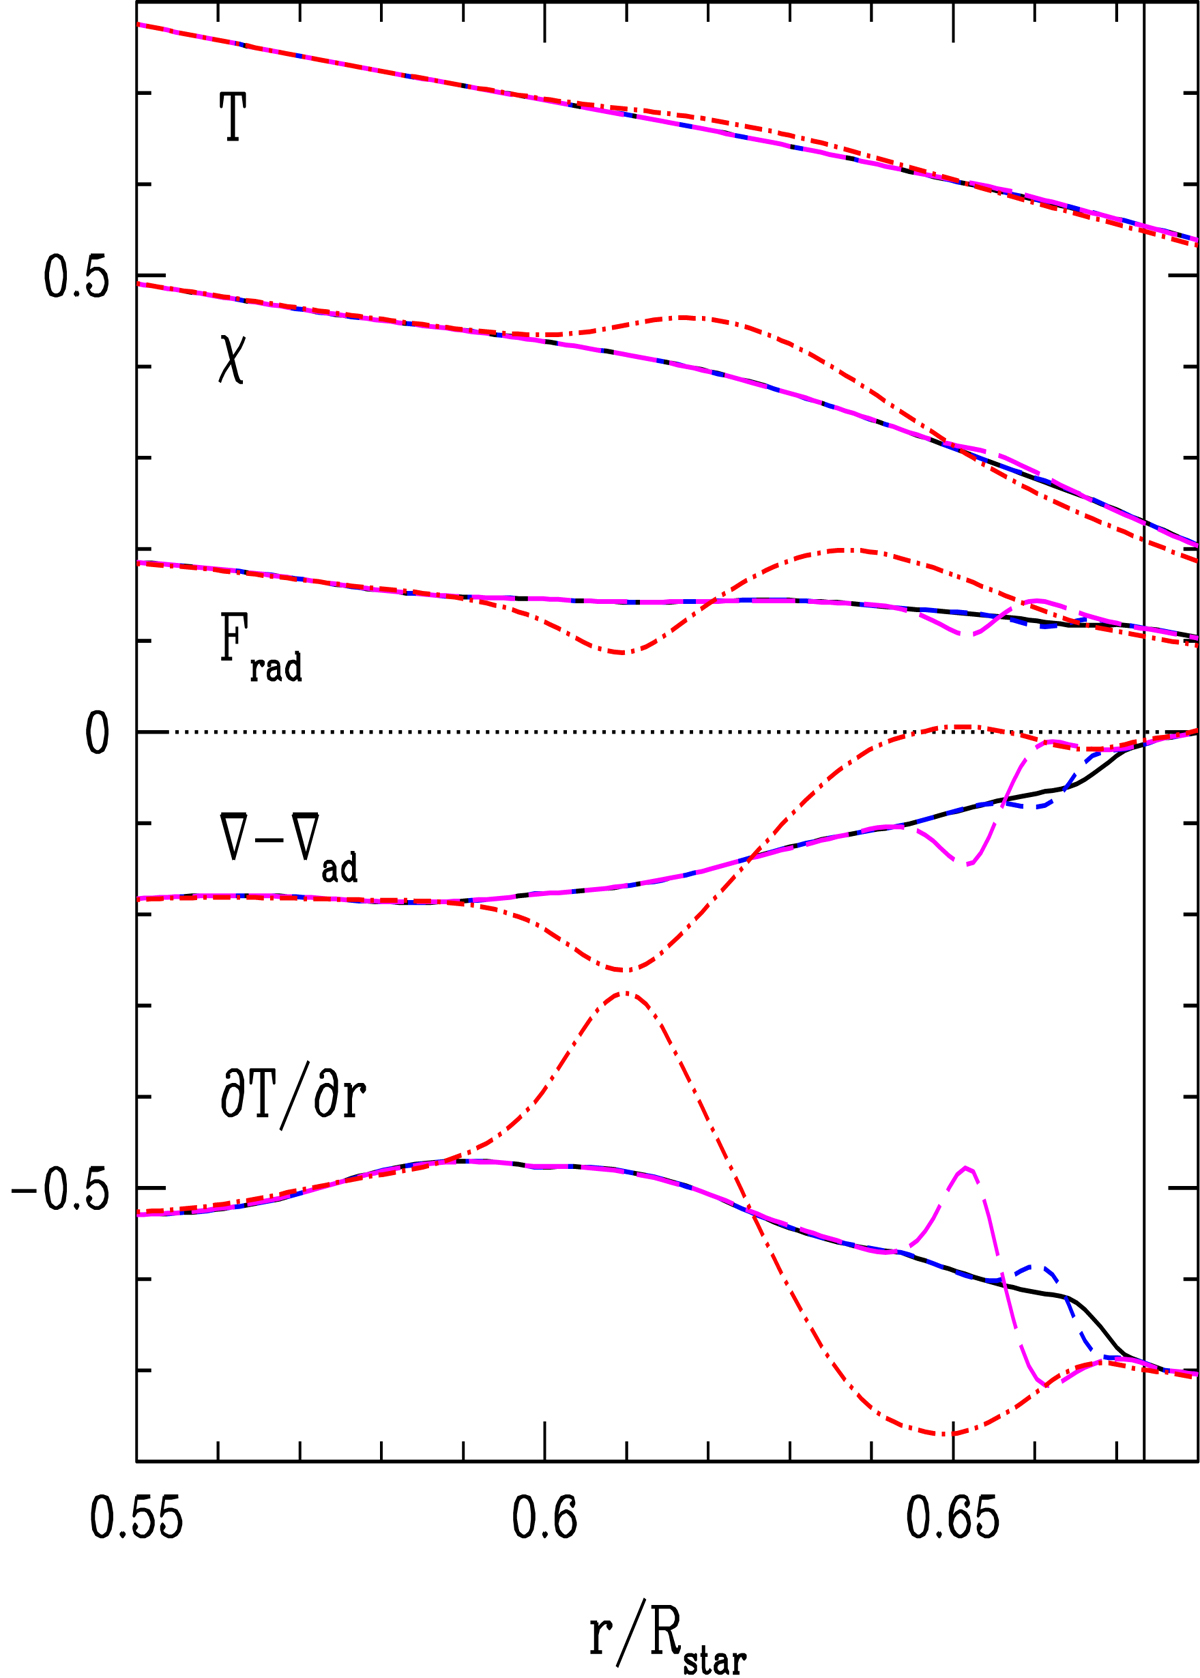
Radial profile of time and space averages of various quantities close to the convective boundary. From top to bottom: the temperature T (in units of 6 × 10⁶ K); the radiative conductivity χ divided by the luminosity enhancement factor of the model and by the constant 4 × 10¹⁵; the radiative flux divided by the luminosity enhancement factor of the model and by the constant 2 × 10¹²; the subadiabaticity ∇ − ∇ad; the radial temperature gradient ∂T/∂r multiplied by the constant 2.8 × 10³. The coloured curves correspond to the four models: ref (black), boost1d1 (blue), boost1d2 (magenta) and boost1d4 (red). The convective boundary corresponding to the Schwarzschild boundary from the 1D initial model is indicated by the vertical solid line.
Current usage metrics show cumulative count of Article Views (full-text article views including HTML views, PDF and ePub downloads, according to the available data) and Abstracts Views on Vision4Press platform.
Data correspond to usage on the plateform after 2015. The current usage metrics is available 48-96 hours after online publication and is updated daily on week days.
Initial download of the metrics may take a while.