Free Access
Fig. 2.
Download original image
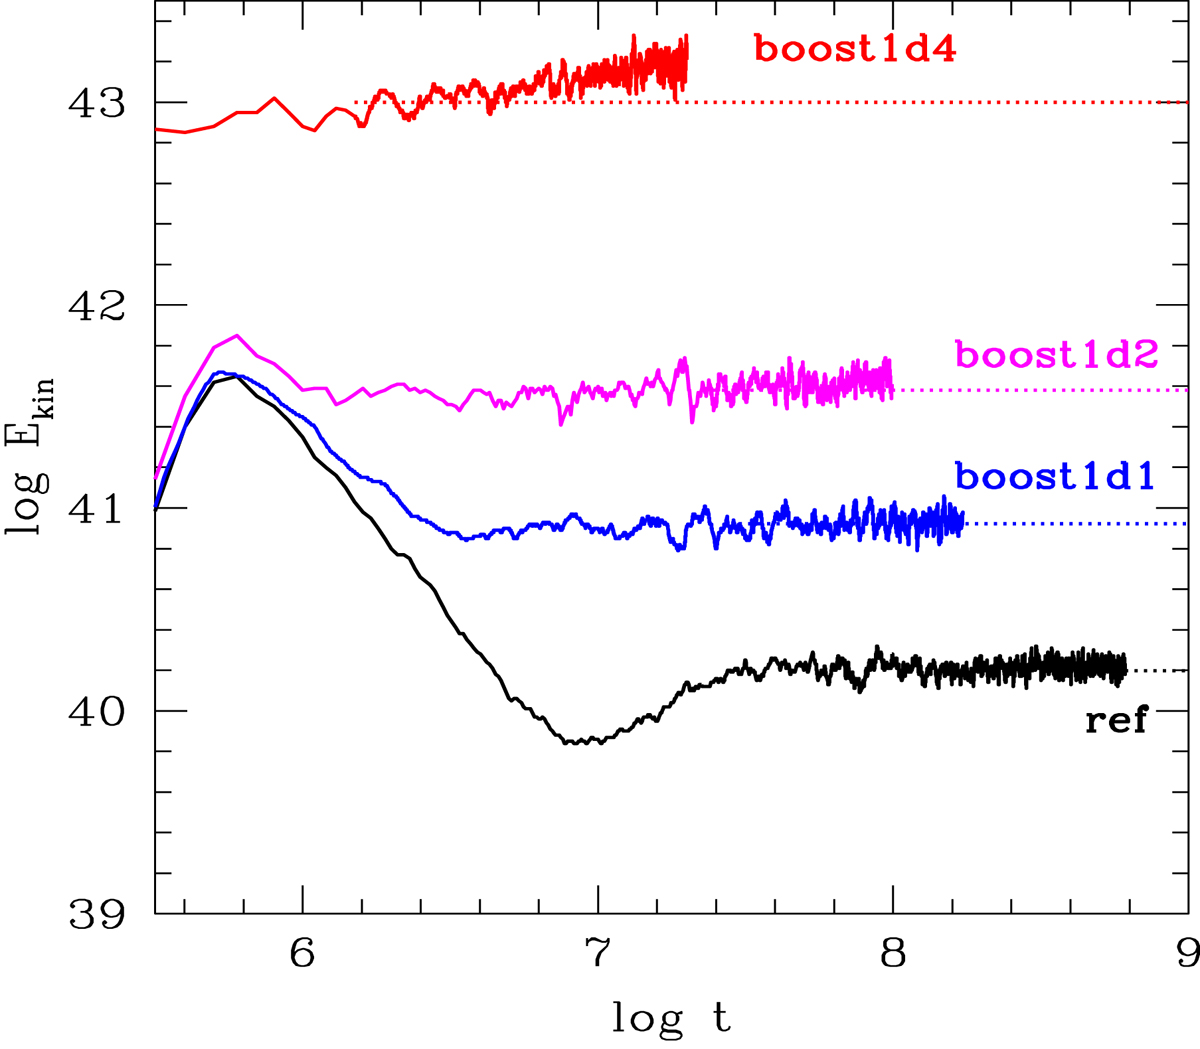
Evolution of the total kinetic energy (in erg) as a function of time (in s) of the simulations described in Table 2. The dotted lines correspond to the value of the total kinetic energy at the beginning of the steady state for convection.
Current usage metrics show cumulative count of Article Views (full-text article views including HTML views, PDF and ePub downloads, according to the available data) and Abstracts Views on Vision4Press platform.
Data correspond to usage on the plateform after 2015. The current usage metrics is available 48-96 hours after online publication and is updated daily on week days.
Initial download of the metrics may take a while.