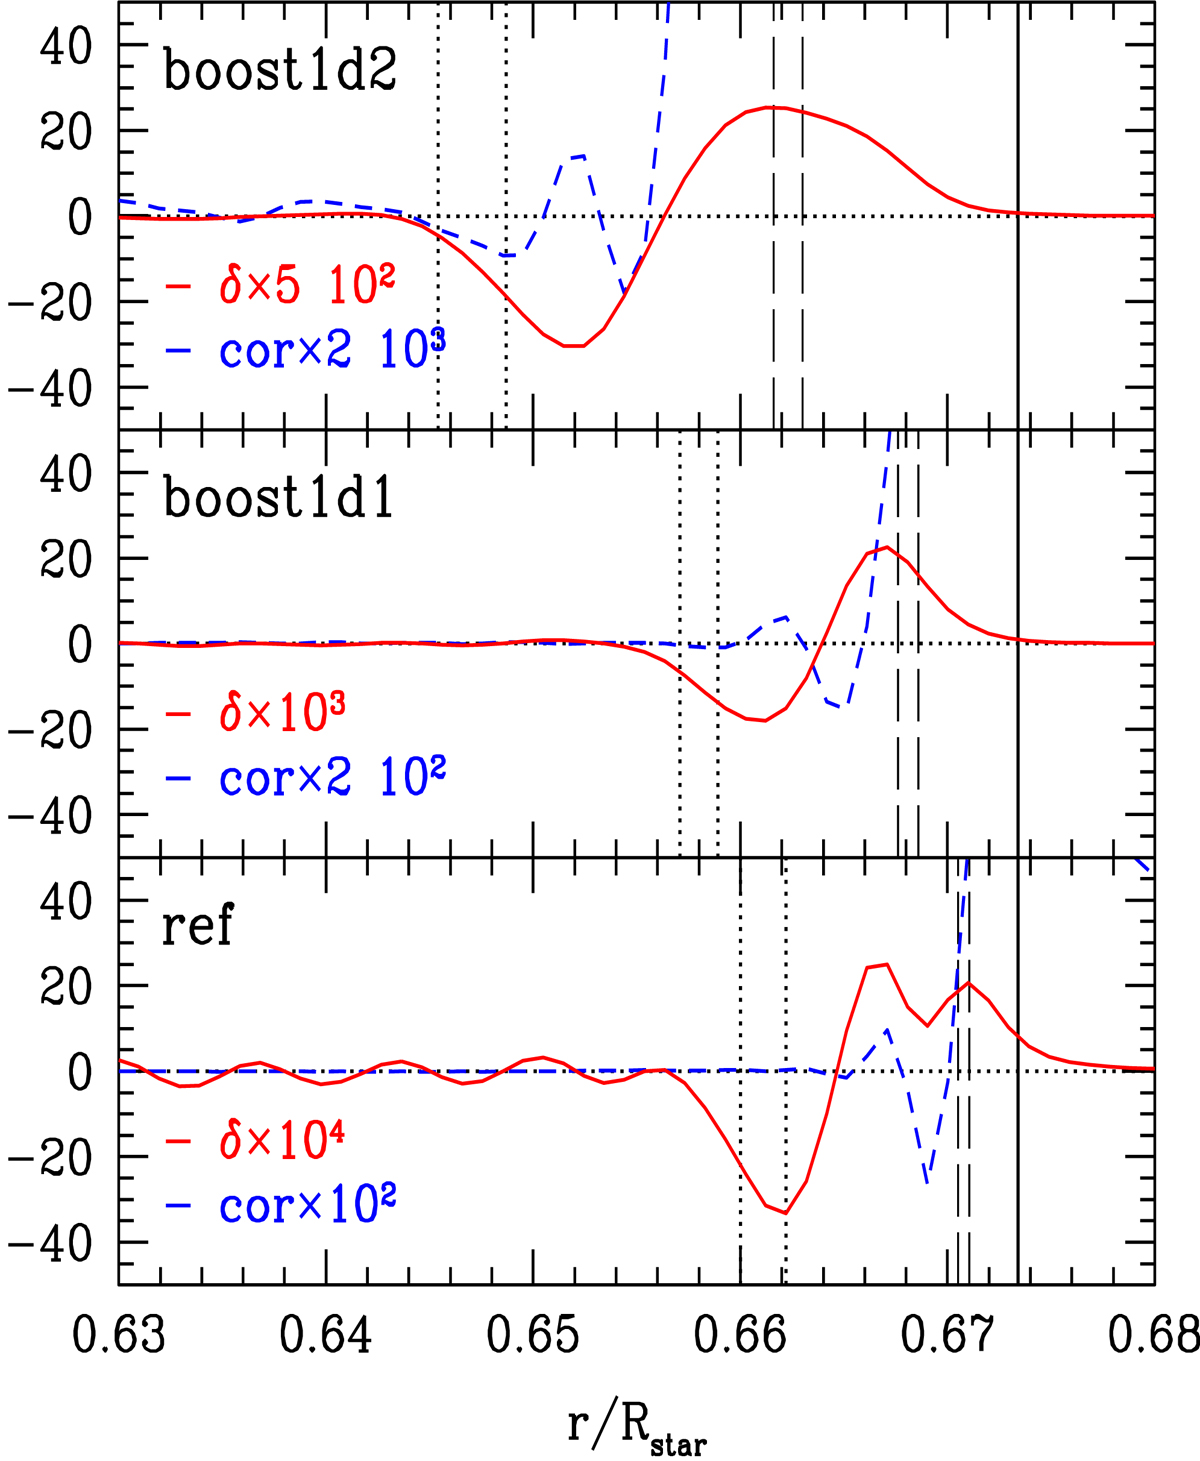
Fig. 14.
Download original image
Solid lines (red): Departure of the subadiabaticity (time and horizontal average) from its initial value δ = ⟨⟨(∇ − ∇ad)⟩θ⟩t − (∇−∇ad)init as a function of radius in the overshooting region for the three models, as indicated in the panels. Dashed lines (blue): radial profile of ⟨cor⟩t, the time average of the radial velocity autocorrelation defined by Eq. (23). Since these quantities are very small, they are multiplied by different constants, as indicated in each panel, in order to see the details. The vertical lines are the same as in Fig. 13.
Current usage metrics show cumulative count of Article Views (full-text article views including HTML views, PDF and ePub downloads, according to the available data) and Abstracts Views on Vision4Press platform.
Data correspond to usage on the plateform after 2015. The current usage metrics is available 48-96 hours after online publication and is updated daily on week days.
Initial download of the metrics may take a while.