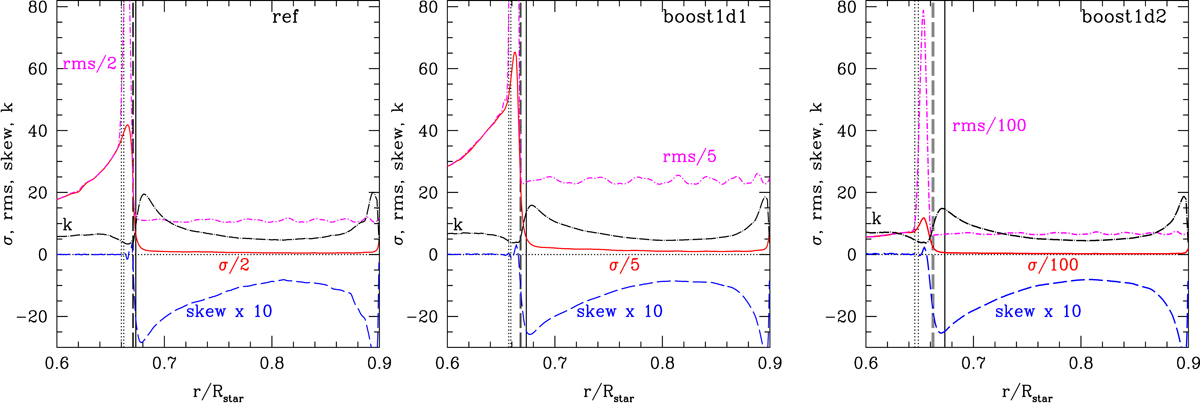
Fig. 13.
Download original image
Time average of standard deviation (solid red), rms (dash-dot magenta), skewness (long dash blue) and kurtosis (long dash-dot black) of the temperature fluctuations for the models indicated in the panels. The convective boundary corresponding to the Schwarzschild boundary from the 1D initial model is indicated by the vertical solid line. The two vertical dotted lines in each panel indicate the extension of the penetration layer lmax based on fk and fδT, respectively. Similarly, the two vertical dashed lines correspond to lbulk.
Current usage metrics show cumulative count of Article Views (full-text article views including HTML views, PDF and ePub downloads, according to the available data) and Abstracts Views on Vision4Press platform.
Data correspond to usage on the plateform after 2015. The current usage metrics is available 48-96 hours after online publication and is updated daily on week days.
Initial download of the metrics may take a while.