Fig. 12.
Download original image
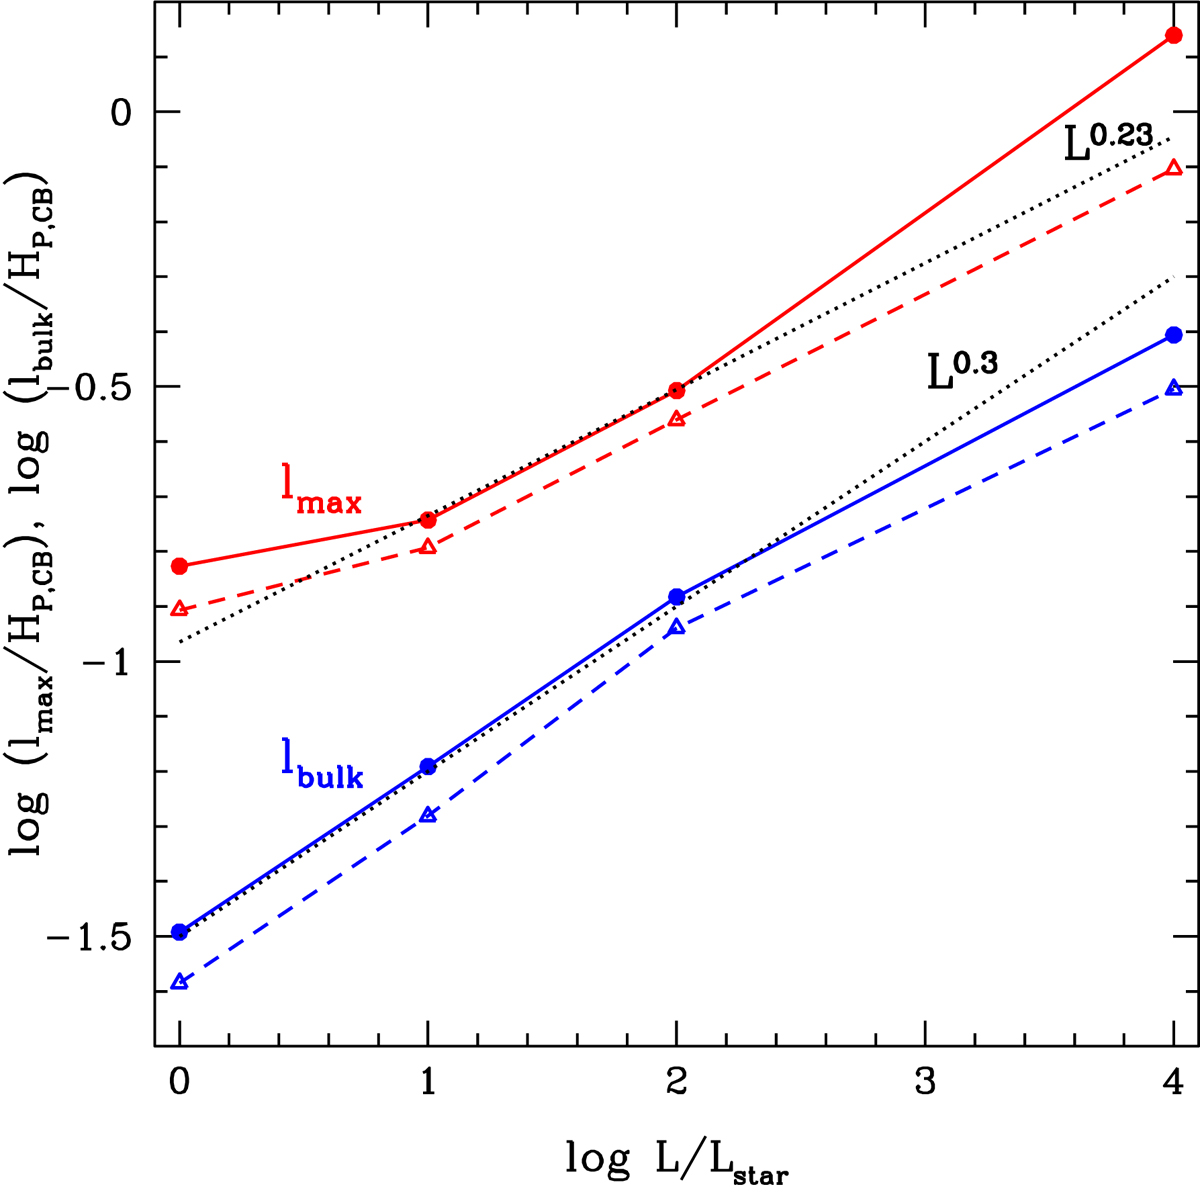
Maximal penetration length lmax (red) and length of the layer where the bulk of the plumes penetrate lbulk (blue curves), in units of the pressure scale height at the convective boundary, as a function of the luminosity of the model. The solid curves and circles are the values derived from the use of fk and the dashed curves and triangles corresponds to the values derived from fδT. The dotted curves show power laws L0.23 and L0.3 as guide for the eyes.
Current usage metrics show cumulative count of Article Views (full-text article views including HTML views, PDF and ePub downloads, according to the available data) and Abstracts Views on Vision4Press platform.
Data correspond to usage on the plateform after 2015. The current usage metrics is available 48-96 hours after online publication and is updated daily on week days.
Initial download of the metrics may take a while.