Fig. 5
Download original image
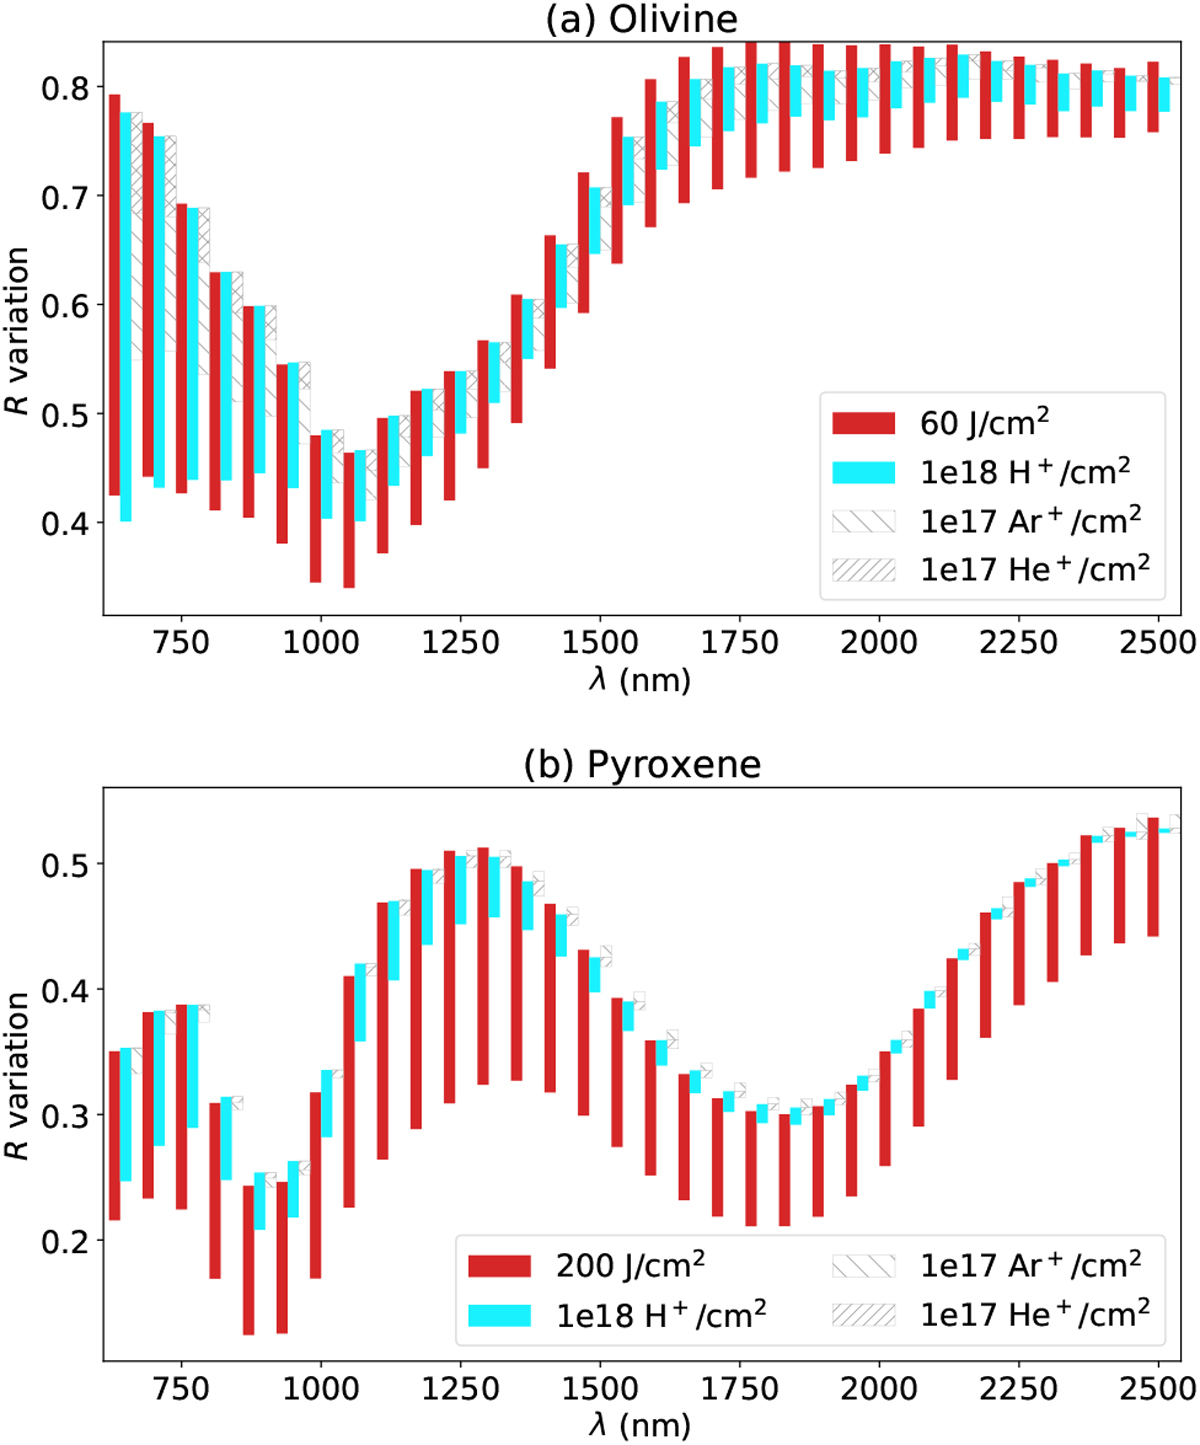
Bar plot showing reflectance, R, variation induced by laser and ion irradiation experiments. Each bar connects at the upper end the reflectance of the fresh material and at the lower end the reflectance of the material weathered to the level stated in the legend. The length of the bar thus shows the variation in the reflectance at the given wavelength, λ. Instead of showing bars at all measured wavelengths, we down-sampled the spectra to 50 nm intervals to enhance readability. H+ stands for hydrogen, He+ for helium, and Ar+ for argon ions.
Current usage metrics show cumulative count of Article Views (full-text article views including HTML views, PDF and ePub downloads, according to the available data) and Abstracts Views on Vision4Press platform.
Data correspond to usage on the plateform after 2015. The current usage metrics is available 48-96 hours after online publication and is updated daily on week days.
Initial download of the metrics may take a while.