Fig. 10
Download original image
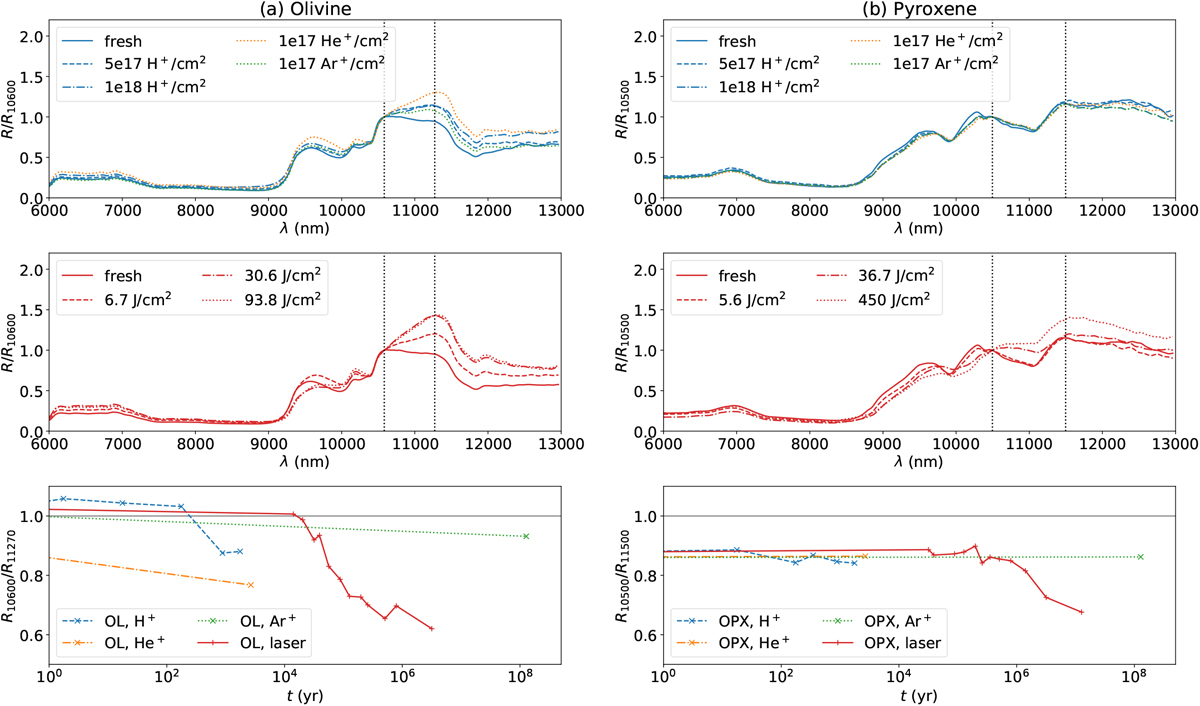
Top and middle: mid-infrared part of some of the spectra of (a) olivine (OL) and (b) pyroxene (OPX) irradiated by ions and by laser. The two dotted lines show the approximate positions of the reflectance values (R), based on which the ratio of the peaks was evaluated. The spectra were normalized at the wavelength (λ) of the first peak used for the ratio calculation to highlight the spectral alteration. Bottom: evolution of the reflectance ratio due to different irradiation set-ups. Time, t, was evaluated for the situation at 1 au (see Appendix C). A grey horizontal line indicates the situation of the flattenedpeaks. H+ stands for hydrogen, He+ for helium, and Ar+ for argon ions.
Current usage metrics show cumulative count of Article Views (full-text article views including HTML views, PDF and ePub downloads, according to the available data) and Abstracts Views on Vision4Press platform.
Data correspond to usage on the plateform after 2015. The current usage metrics is available 48-96 hours after online publication and is updated daily on week days.
Initial download of the metrics may take a while.