Fig. 8
Download original image
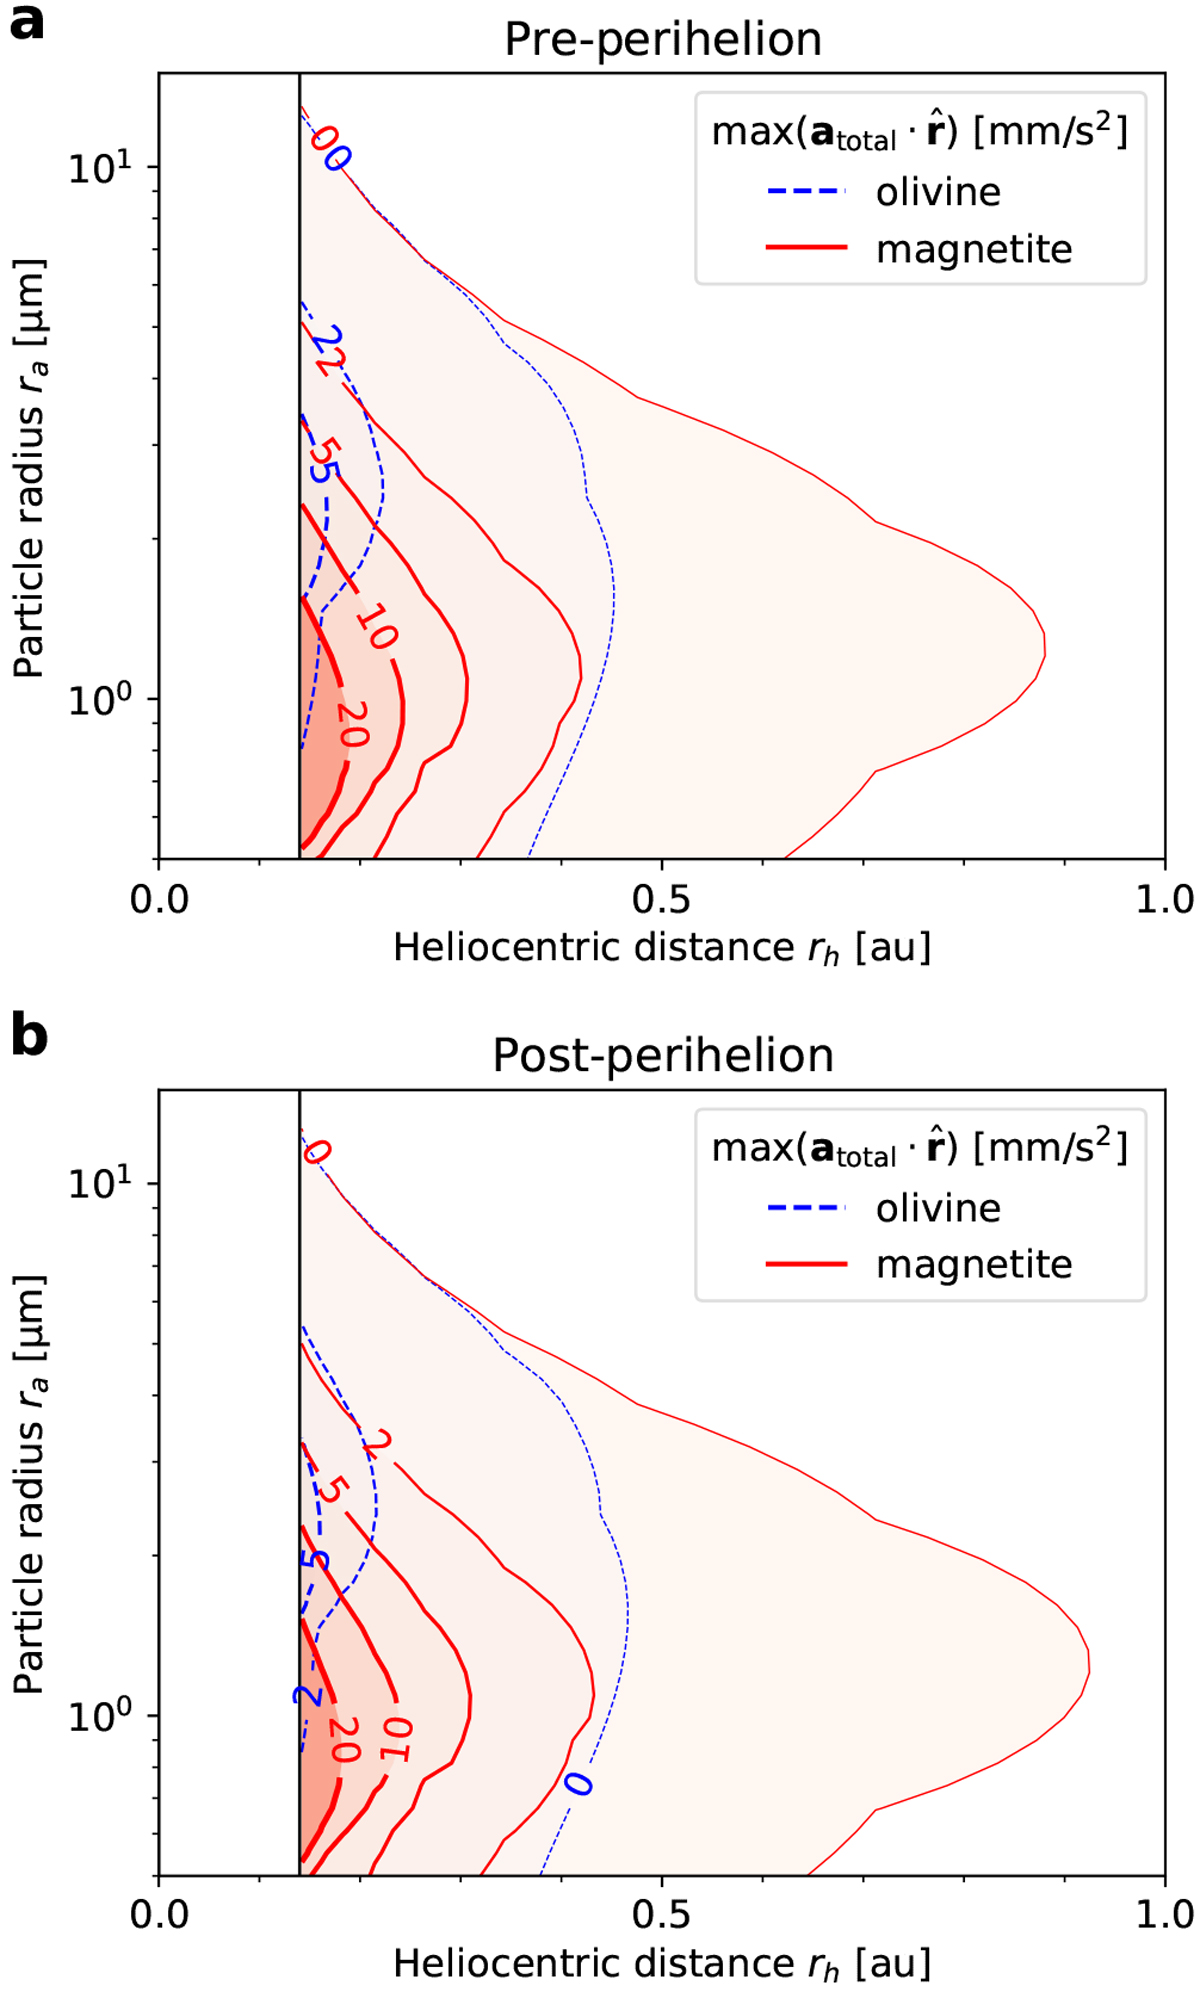
Maximum radial acceleration on the Phaethon’s equator. As in Fig. 6, the maximum acceleration on the equator is calculated for a wide range of particle sizes (0.5- 40 μm) before (a) and after (b) the perihelion passage. The black vertical line corresponds to thePhaethon’s perihelion. The numbers on the contour plots are in units of mm s-2, and the thickness of the contour increases as the acceleration value increases for fixed contour levels
![]() . The blue dashed and red solid lines indicate olivine and magnetite, respectively.
. The blue dashed and red solid lines indicate olivine and magnetite, respectively.
Current usage metrics show cumulative count of Article Views (full-text article views including HTML views, PDF and ePub downloads, according to the available data) and Abstracts Views on Vision4Press platform.
Data correspond to usage on the plateform after 2015. The current usage metrics is available 48-96 hours after online publication and is updated daily on week days.
Initial download of the metrics may take a while.