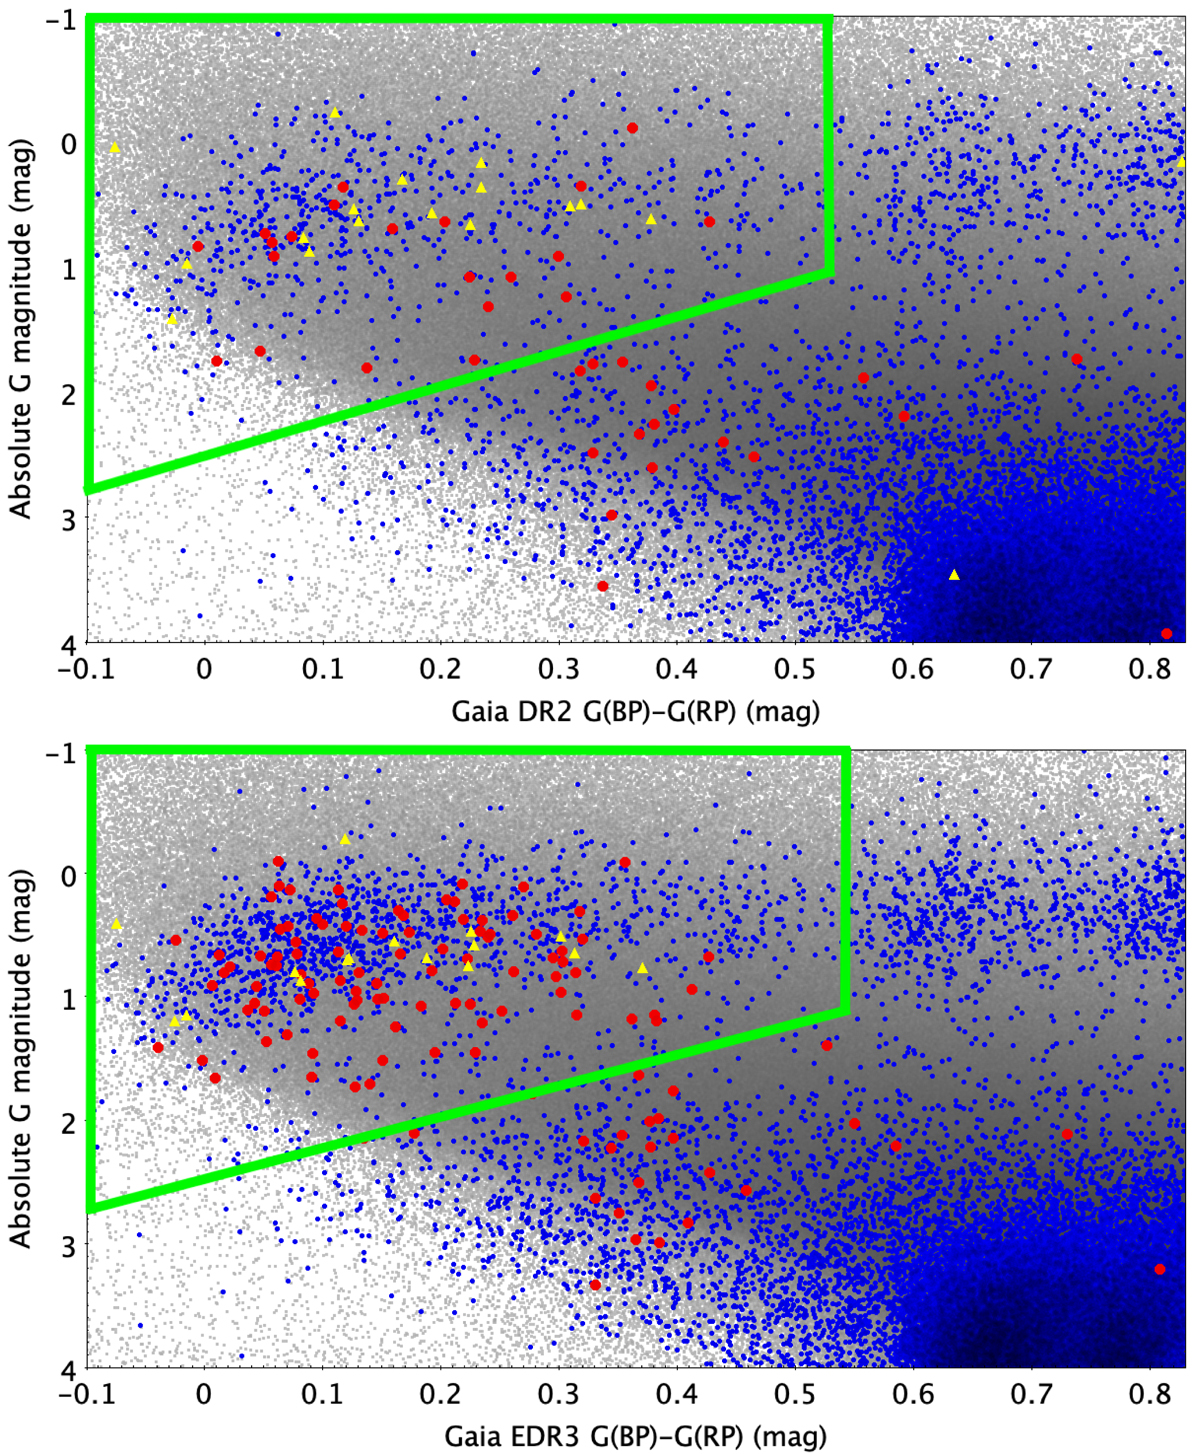
Fig. 8.
Download original image
Top panel: objects that satisfy the modified (Lindegren et al. 2018) criteria (gray points) with those with the stringent halo criteria and the crowded region criterion applied (small light blue dots). Xue et al. (2008) objects (red circles) and Behr (2003) objects (yellow triangles) are superimposed. The green trapezium denotes the Gaia DR2 colour-magnitude coordinate space (final CMD criteria) considered as the (blue horizontal-branch region) displayed in DR2 (upper panel) and EDR3 (lower panel).
Current usage metrics show cumulative count of Article Views (full-text article views including HTML views, PDF and ePub downloads, according to the available data) and Abstracts Views on Vision4Press platform.
Data correspond to usage on the plateform after 2015. The current usage metrics is available 48-96 hours after online publication and is updated daily on week days.
Initial download of the metrics may take a while.