Fig. 5.
Download original image
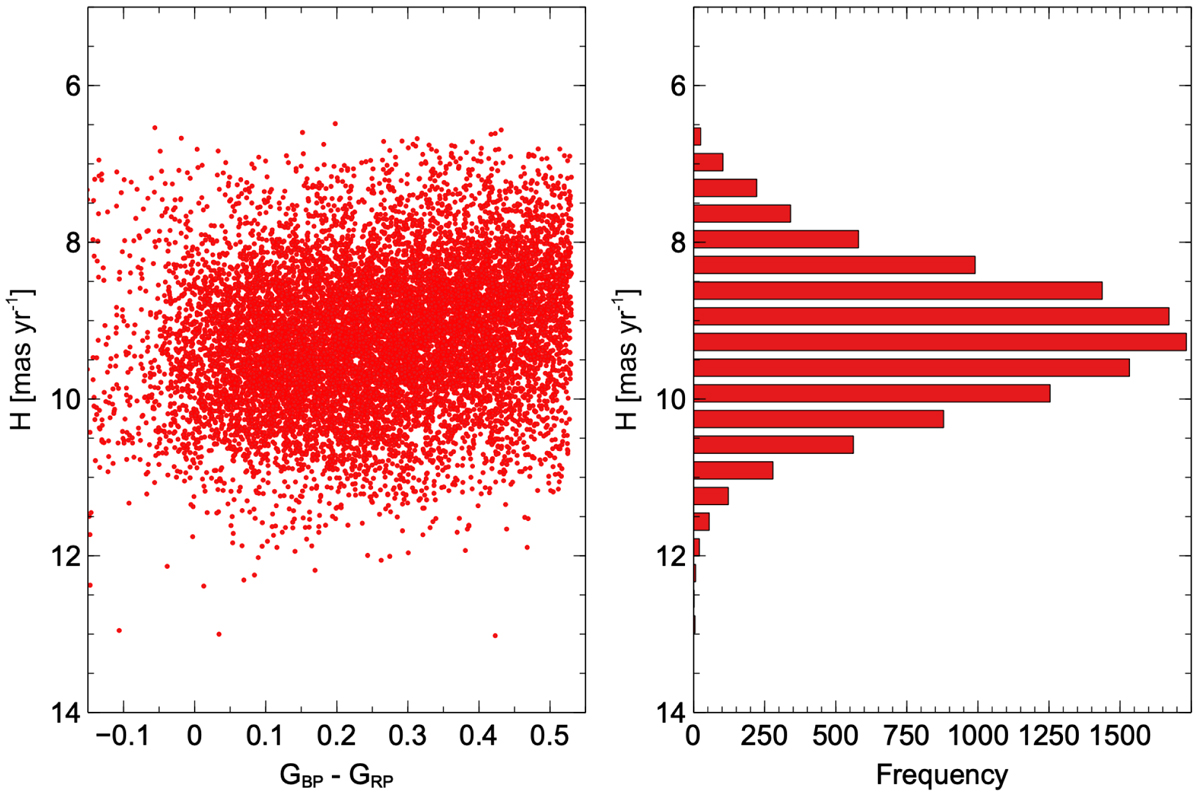
Gaia DR2 reduced proper motion versus colour diagram and reduced proper motion frequency plot used to define the selection criteria for the objects with a parallax error ≥ 20%. Left panel: reduced proper motion (H) versus colour (GBP − GRP) diagram for the blue horizontal-branch candidates with parallax error < 20%. Right panel: distribution of reduced proper motion (H) seen in the blue horizontal-branch candidates with a parallax error < 20%.
Current usage metrics show cumulative count of Article Views (full-text article views including HTML views, PDF and ePub downloads, according to the available data) and Abstracts Views on Vision4Press platform.
Data correspond to usage on the plateform after 2015. The current usage metrics is available 48-96 hours after online publication and is updated daily on week days.
Initial download of the metrics may take a while.