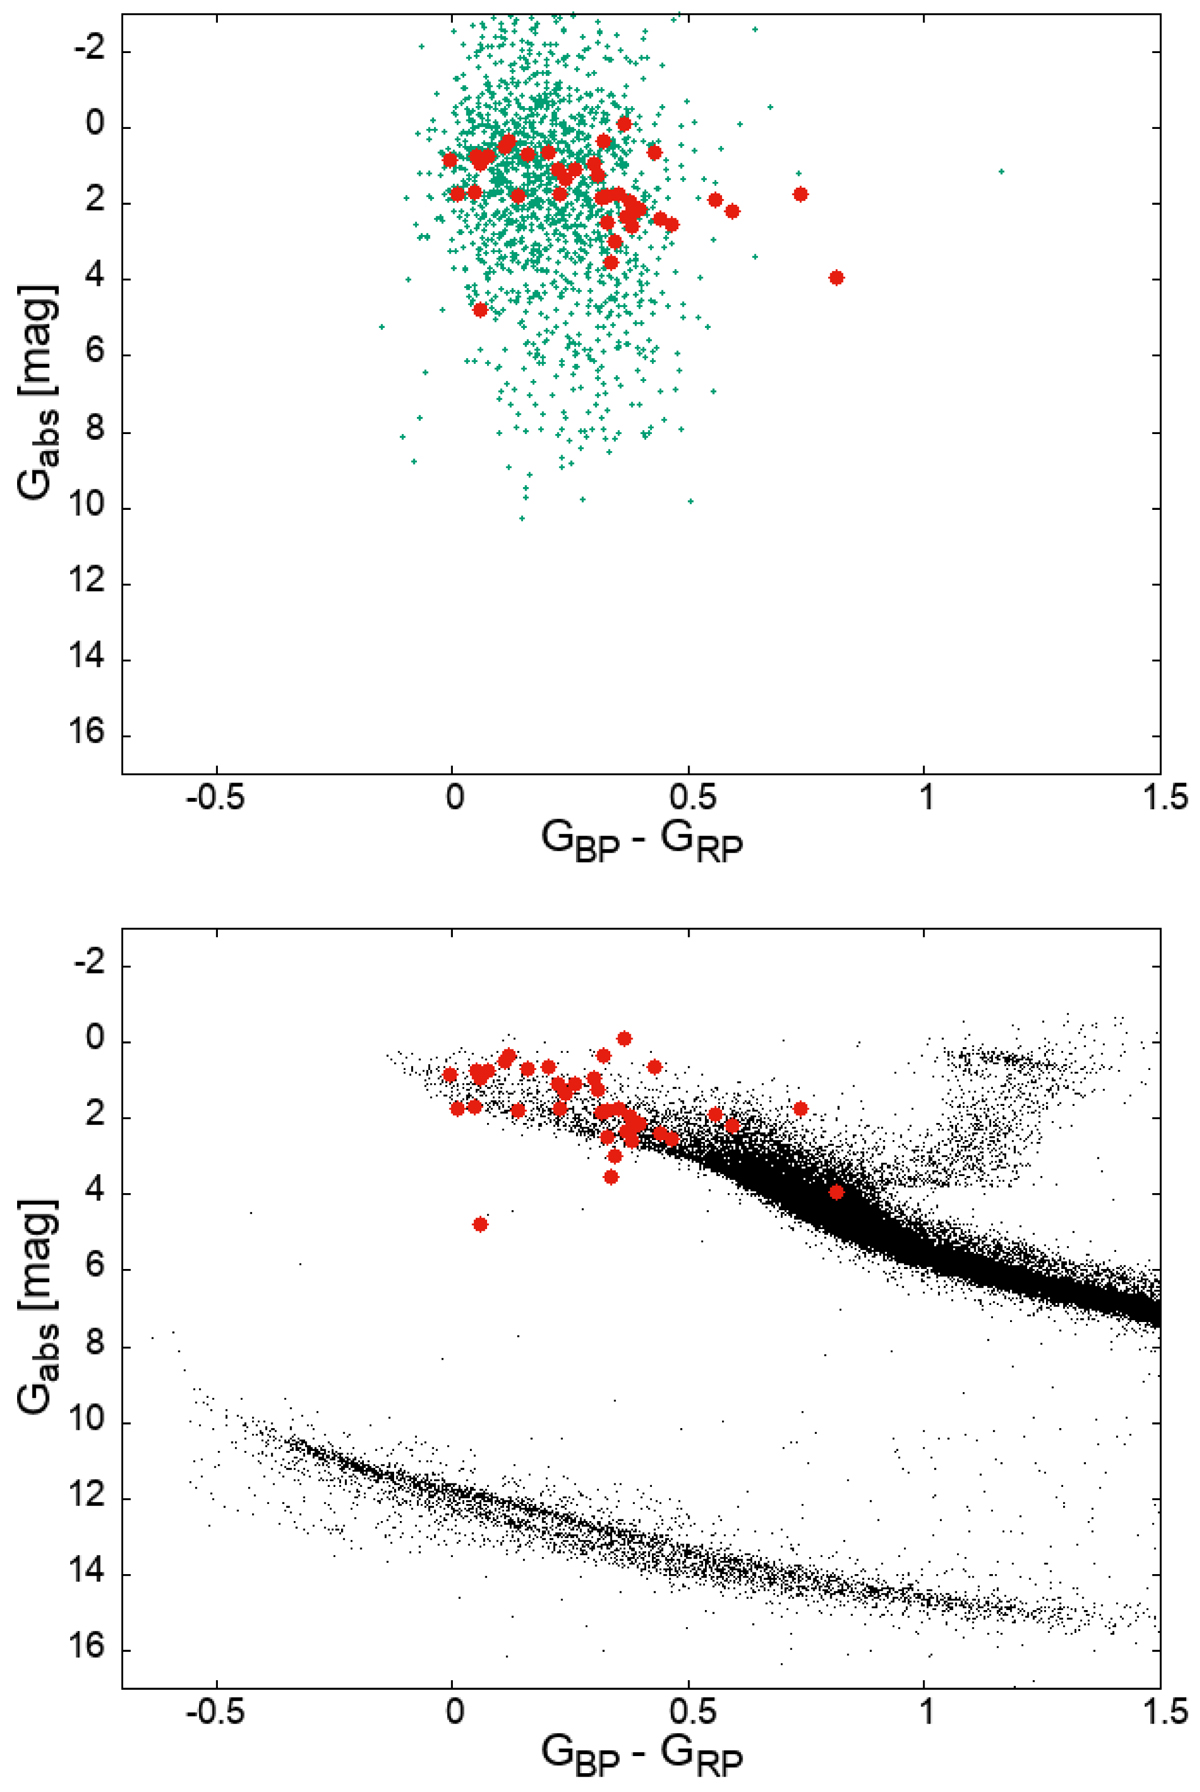
Fig. 2.
Download original image
Result of cross-matching the Xue et al. (2008) reference dataset with Gaia DR2. Upper panel: Xue et al. (2008) objects plotted as turquoise dots on the Gaia DR2 colour-magnitude diagram exhibiting a large scatter in absolute magnitude due to incorrect parallax measurements. Those with parallax error < 20% are plotted as red large dots. Lower panel: Lindegren et al. (2018) ‘clean subset selection C’ (black) compared with Xue et al. (2008) objects with parallax error < 20% (red) on the same scales as the upper plot in the Gaia DR2 colour-magnitude diagram.
Current usage metrics show cumulative count of Article Views (full-text article views including HTML views, PDF and ePub downloads, according to the available data) and Abstracts Views on Vision4Press platform.
Data correspond to usage on the plateform after 2015. The current usage metrics is available 48-96 hours after online publication and is updated daily on week days.
Initial download of the metrics may take a while.