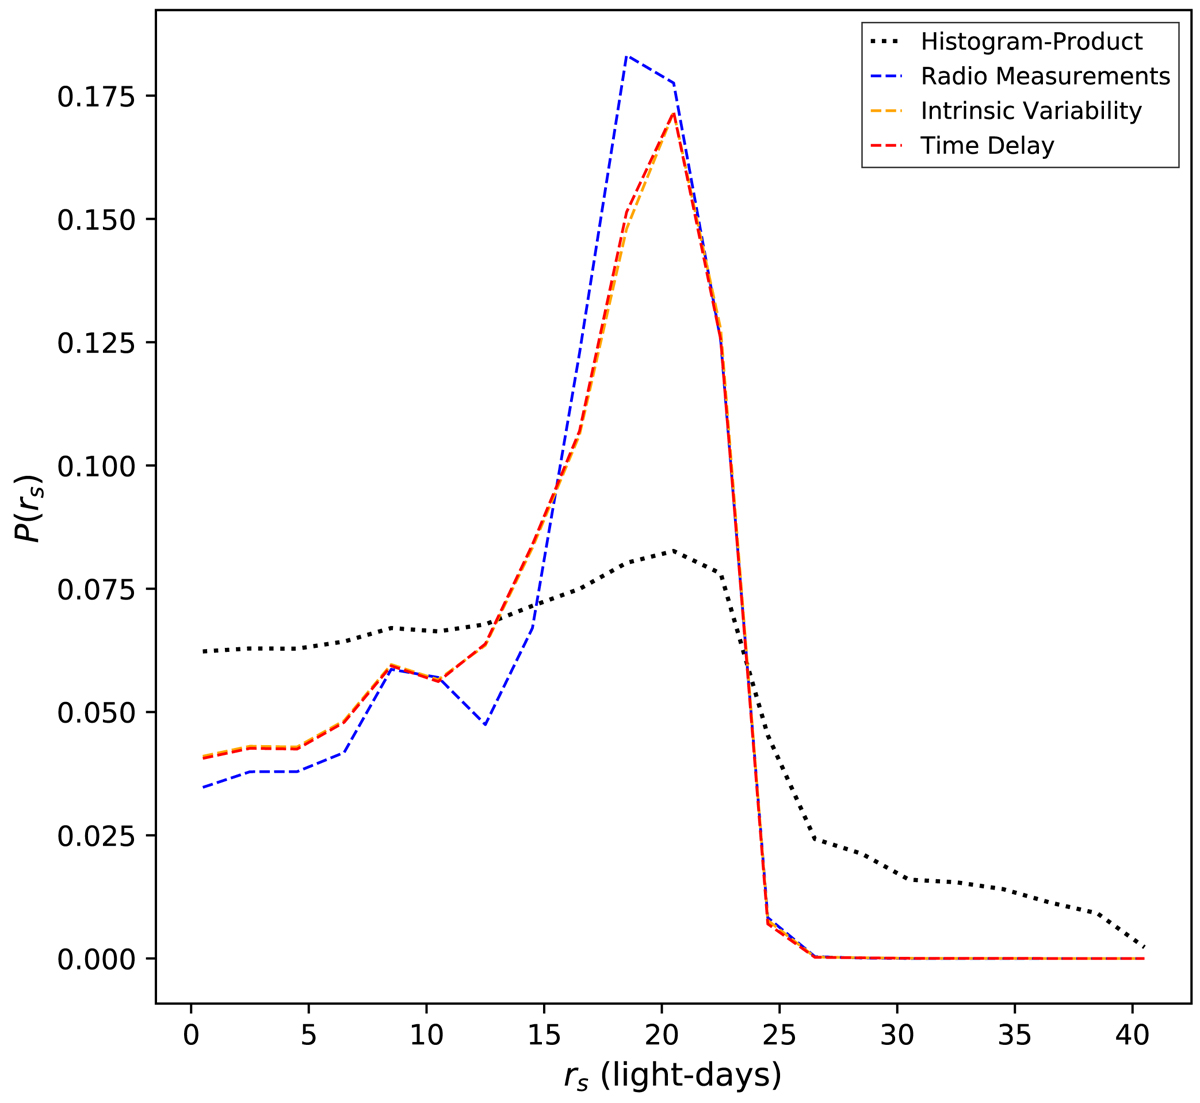
Fig. 6.
Download original image
Probability density distribution of the source size rs using a time delay of Δt = 417 days, a radio-flux ratio of B/A = 0.74, a linear interpolation of image A’s light curve as an intrinsic variability model, and the lens model parameters of Mediavilla et al. (2009) (dotted black line). The dashed lines show the PDFs for various model/data-related analyses as indicated by the legend. These are obtained by multiplying single probability distributions corresponding to different time delays (red), models for the intrinsic variability (orange; see Table 4), and radio measurements (blue; see Table 6). We note that the red and orange distributions overlap.
Current usage metrics show cumulative count of Article Views (full-text article views including HTML views, PDF and ePub downloads, according to the available data) and Abstracts Views on Vision4Press platform.
Data correspond to usage on the plateform after 2015. The current usage metrics is available 48-96 hours after online publication and is updated daily on week days.
Initial download of the metrics may take a while.