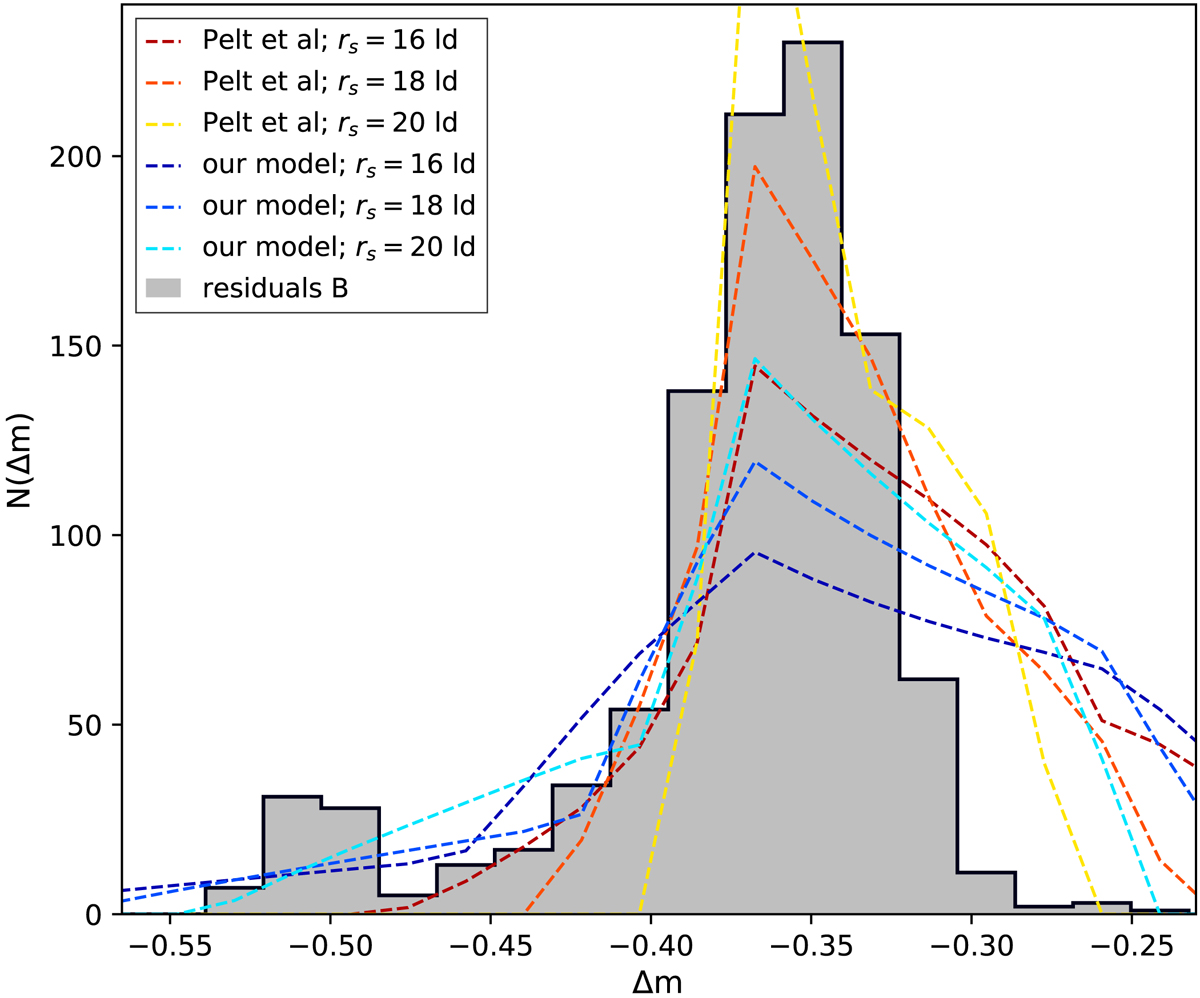
Fig. 5.
Download original image
Microlensing frequency distributions obtained from the observations, i.e, the difference light curve presented in the lower panel of Fig. 4 (gray histogram), and the simulated magnification maps (segmented lines). The various segmented lines correspond to convolutions of the simulated magnification maps with sources of different sizes (in blue shades for our macrolens model and in red shades for the model of Pelt et al. 1998).
Current usage metrics show cumulative count of Article Views (full-text article views including HTML views, PDF and ePub downloads, according to the available data) and Abstracts Views on Vision4Press platform.
Data correspond to usage on the plateform after 2015. The current usage metrics is available 48-96 hours after online publication and is updated daily on week days.
Initial download of the metrics may take a while.