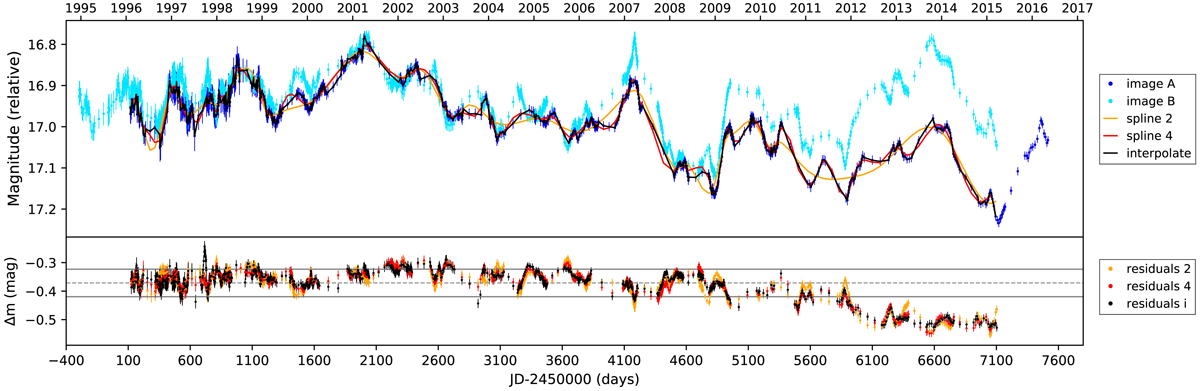
Fig. 4.
Download original image
Top: image A and B light curves of Q 0957+561 in their overlapping region after shifting by the time delay. The linear interpolation of image A’s light curve is shown in black, and two different models for the intrinsic variability of the quasar (splines with different knot steps fit to light curve A) are shown in red and in orange. To avoid confusion, we only display two out of four spline fittings. Bottom: differential microlensing variability of the light curve B compared to the linear interpolation (black)/spline fits (red and orange) to light curve A. The dashed horizontal line shows the mean value of the residuals. We note that the residuals have been corrected for the magnitude difference between the images using radio data.
Current usage metrics show cumulative count of Article Views (full-text article views including HTML views, PDF and ePub downloads, according to the available data) and Abstracts Views on Vision4Press platform.
Data correspond to usage on the plateform after 2015. The current usage metrics is available 48-96 hours after online publication and is updated daily on week days.
Initial download of the metrics may take a while.