Open Access
Fig. B.2
Download original image
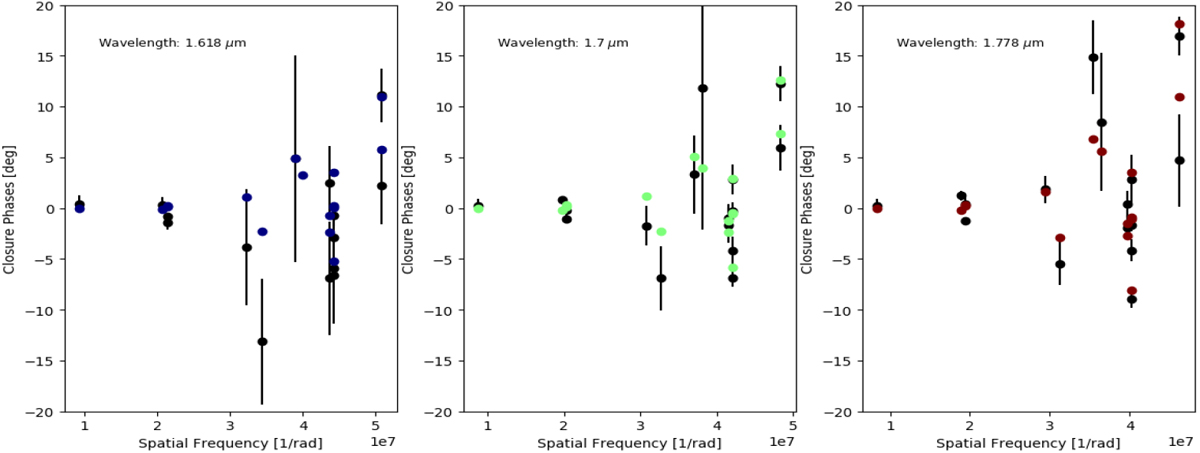
Observations vs. Ring model for the 2013 run. Panels display the closure phase (black dots) from the data vs. spatial frequency. Each panel corresponds to a different wavelength (see labels on the panels). The synthetic observables obtained from the best-fit Ring model are over-plotted with different colors in the panels.
Current usage metrics show cumulative count of Article Views (full-text article views including HTML views, PDF and ePub downloads, according to the available data) and Abstracts Views on Vision4Press platform.
Data correspond to usage on the plateform after 2015. The current usage metrics is available 48-96 hours after online publication and is updated daily on week days.
Initial download of the metrics may take a while.