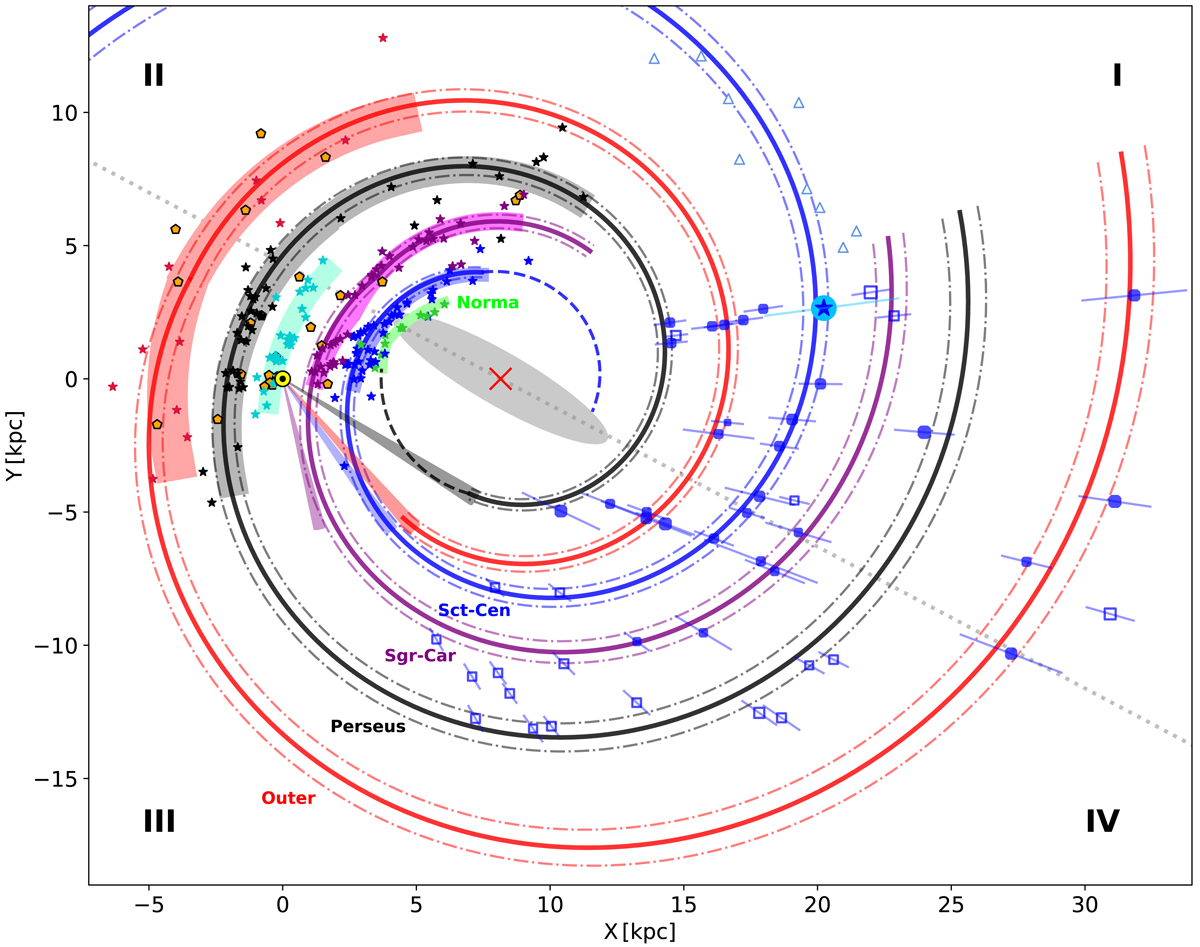
Fig. 2.
Download original image
Milky Way spiral structure as traced by CCs and HMSFRs. The distribution of our sample of spectroscopically confirmed CCs in the first and fourth quadrants is shown here (blue circles). We overplot the OGLE CCs with distances based on near-IR photometry (blue open squares). Distance error bars are indicated for each star. The point sizes are inversely proportional to the Cepheid ages. We also included the maser source presented in Sanna et al. (2017) (blue star inside circle). The Sun is located at (X = 0 kpc, Y = 0 kpc) and marked with a yellow dot, and the Galactic center is marked with a red cross at (X = 8.15 kpc, Y = 0 kpc). As in Fig. 1, the log-periodic spiral arm segment fits based on VLBI trigonometric parallaxes of HMSFRs by R19 are represented with colored sections. The turquoise spiral segment is the Local arm. The masers associated with each arm in R19 are overplotted using stars (Norma arm, green; Sct-Cen arm, blue; Sgr-Car arm, purple; Local arm, turquoise; Perseus arm, black; Outer arm, red). The thick lines represent our qualitative logarithmic spiral arm fits, with slight changes to R19 best-fit coefficients in order to have them passing through our CCs, with the thin dashed lines marking the 1σ arm widths reported in R19. We also included maser sources associated with HMSFRs recently reported in the VLBI Exploration of Radio Astrometry (VERA; VERA Collaboration 2020) catalog (orange pentagons). The Carina, Centaurus (2 peaks), and Norma tangency directions are displayed as colored light cones originating from the Sun, using the same colors as for their associated spiral arms. The line of nodes of the Galactic warp model by Skowron et al. (2019a) is also shown for reference (gray dotted line). We have included the positions of the CO detections reported by Dame & Thaddeus (2011) that trace the continuation of the Sct-Cen arm on the far side of the Galaxy (open triangles). Their kinematic distances were recalculated using the MW rotation curve determined by Mróz et al. (2019).
Current usage metrics show cumulative count of Article Views (full-text article views including HTML views, PDF and ePub downloads, according to the available data) and Abstracts Views on Vision4Press platform.
Data correspond to usage on the plateform after 2015. The current usage metrics is available 48-96 hours after online publication and is updated daily on week days.
Initial download of the metrics may take a while.