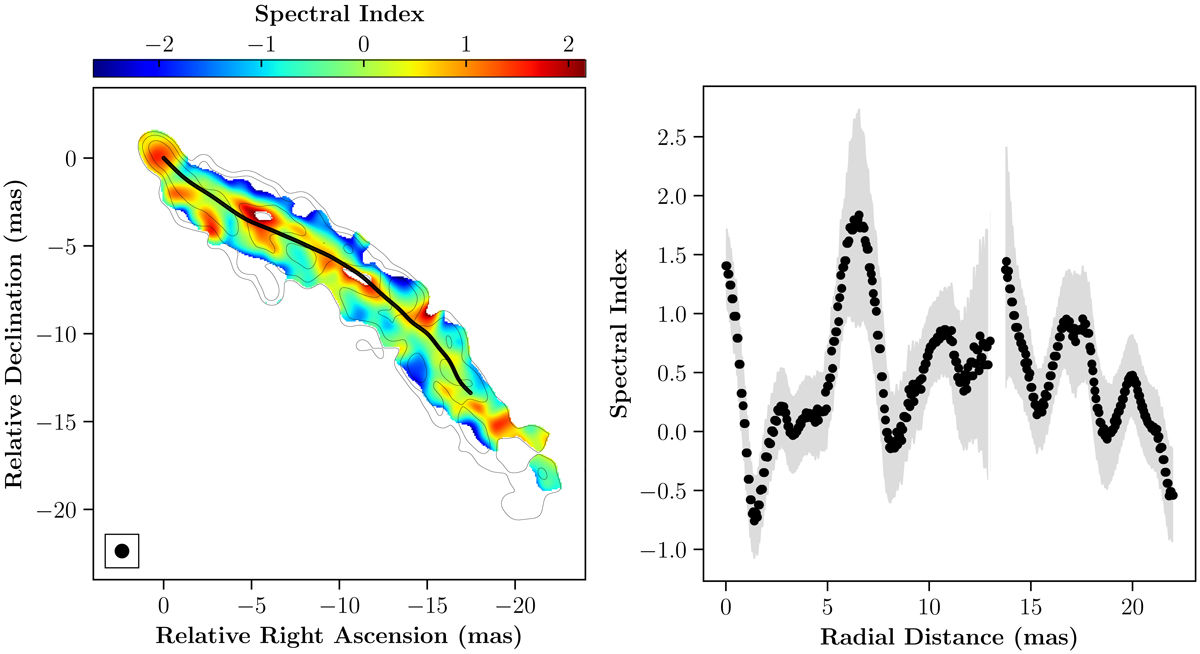
Fig. 6.
Download original image
Left panel: spectral index map obtained from the RadioAstron images of 3C 273 at 1.6 GHz and 4.8 GHz, both restored considering only the common UV-range 2.5−340 Mλ, and convolved with the MOJAVE circular beam (0.83 × 0.83 mas). The map is plotted over the 1.6 GHz image shown in contours. Pixel values below 5σ for both the 1.6 GHz and 4.8 GHz images were blanked. Right panel: spectral index value and its uncertainty along the jet axis, plotted as a function of the radial distance from the core. The adopted convention for the spectral index α is S ∝ να.
Current usage metrics show cumulative count of Article Views (full-text article views including HTML views, PDF and ePub downloads, according to the available data) and Abstracts Views on Vision4Press platform.
Data correspond to usage on the plateform after 2015. The current usage metrics is available 48-96 hours after online publication and is updated daily on week days.
Initial download of the metrics may take a while.