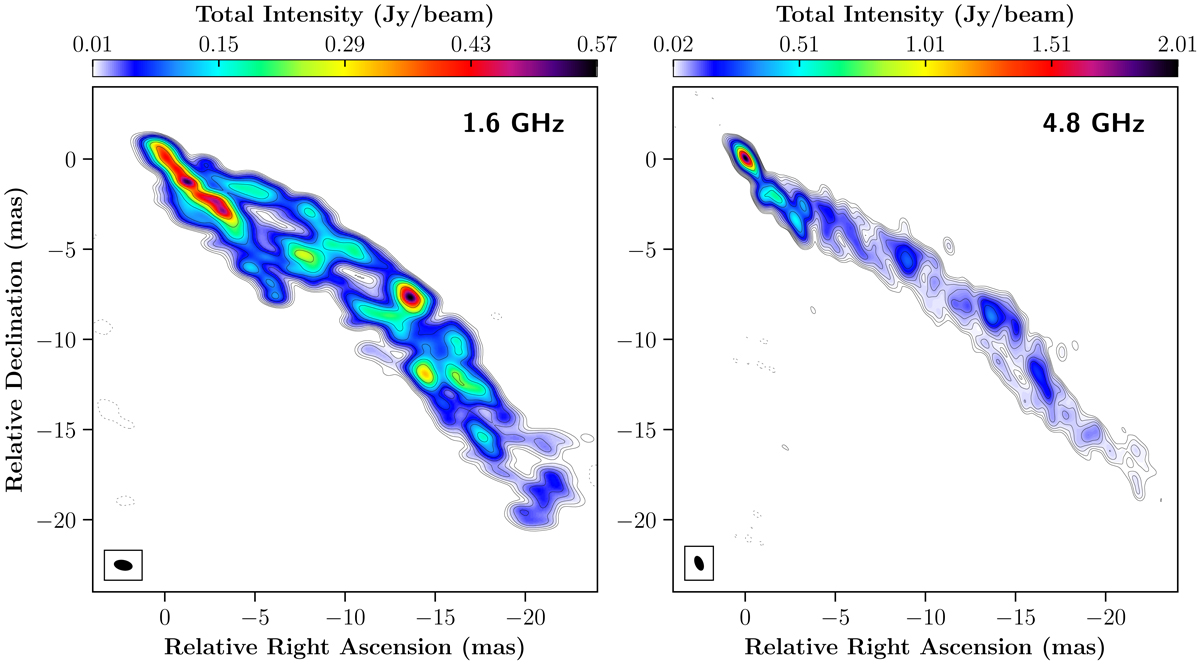
Fig. 2.
Download original image
RadioAstron images of 3C 273 at 1.6 GHz (left panel, June 2014) and 4.8 GHz (right panel, April 2014). The beam is shown on the lower-left corner: 1.04 × 0.58 mas, PA 79.4° at 1.6 GHz, and 0.86 × 0.46 mas, PA 22.0° at 4.8 GHz. The two lowest contour levels are ±3 and ±7 times the rms of the image noise level (3 × 3.5 mJy beam−1 at 1.6 GHz, 7 × 2.2 mJy beam−1 at 4.8 GHz). Successive contours are drawn as cn = (3/2)×cn − 1 up to 90% of the total intensity peak (0.57 Jy beam−1 at 1.6 GHz, 2.01 Jy beam−1 at 4.8 GHz).
Current usage metrics show cumulative count of Article Views (full-text article views including HTML views, PDF and ePub downloads, according to the available data) and Abstracts Views on Vision4Press platform.
Data correspond to usage on the plateform after 2015. The current usage metrics is available 48-96 hours after online publication and is updated daily on week days.
Initial download of the metrics may take a while.