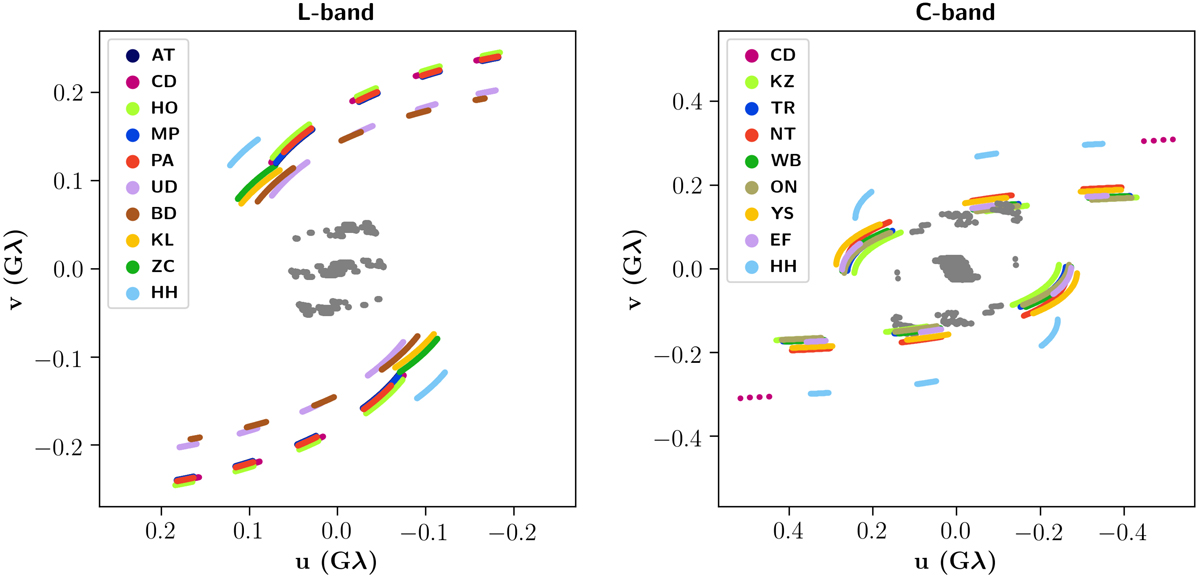
Fig. 1.

Download original image
u, v-coverage for RadioAstron observations at 1.6 GHz (left panel) and 4.8 GHz (right panel) presented in this work. The central bulge (in grey) of u, v-tracks span about one Earth diameter (ground stations baselines), while the “wings” (in colors) represent the RadioAstron Space-baselines contribution. Only space-segments giving fringes are plotted, i.e., up to a maximum projected space–ground baseline of ∼4.5 ED at 1.6 GHz and ∼3.3 ED at 4.8 GHz.
Current usage metrics show cumulative count of Article Views (full-text article views including HTML views, PDF and ePub downloads, according to the available data) and Abstracts Views on Vision4Press platform.
Data correspond to usage on the plateform after 2015. The current usage metrics is available 48-96 hours after online publication and is updated daily on week days.
Initial download of the metrics may take a while.


