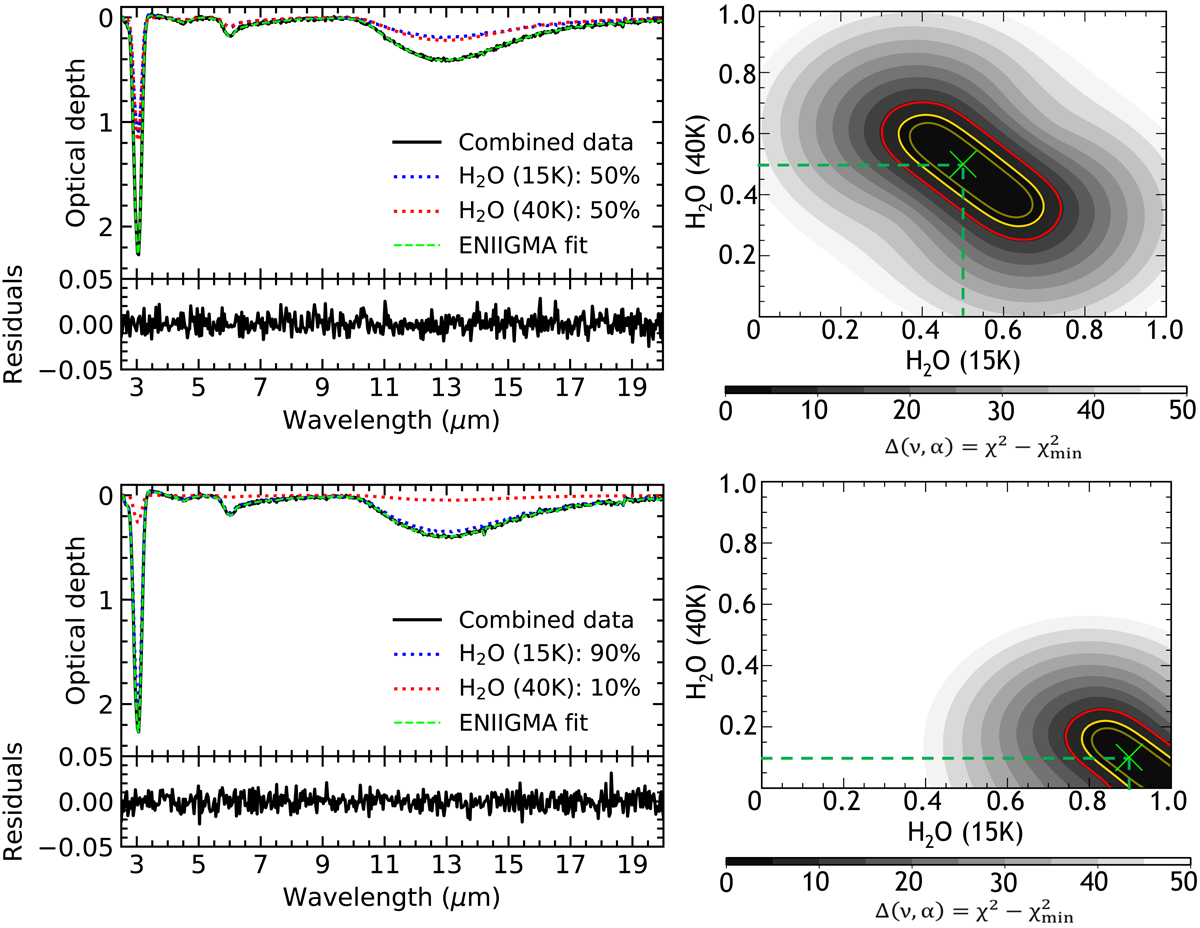
Fig. 8.
Download original image
Spectral decomposition and confidence interval analysis of the ENIIGMA results. Left panels: spectral decomposition of the combined water ice spectra (black solid line) with proportions of 50:50 and 90:10. The components of the decomposition are given by the red and blue dotted lines, whereas the ENIIGMA fit is given by the green dashed line. The residual of the fit is shown in the bottom parts of these graphs. Right panels: confidence interval analysis of the coefficients in the linear combination. The grey-scale colours are the difference between chi-square and minimum chi-square values; the olive, yellow, and red contours are 1σ, 2σ, and 3σ confidence intervals, respectively.
Current usage metrics show cumulative count of Article Views (full-text article views including HTML views, PDF and ePub downloads, according to the available data) and Abstracts Views on Vision4Press platform.
Data correspond to usage on the plateform after 2015. The current usage metrics is available 48-96 hours after online publication and is updated daily on week days.
Initial download of the metrics may take a while.