Free Access
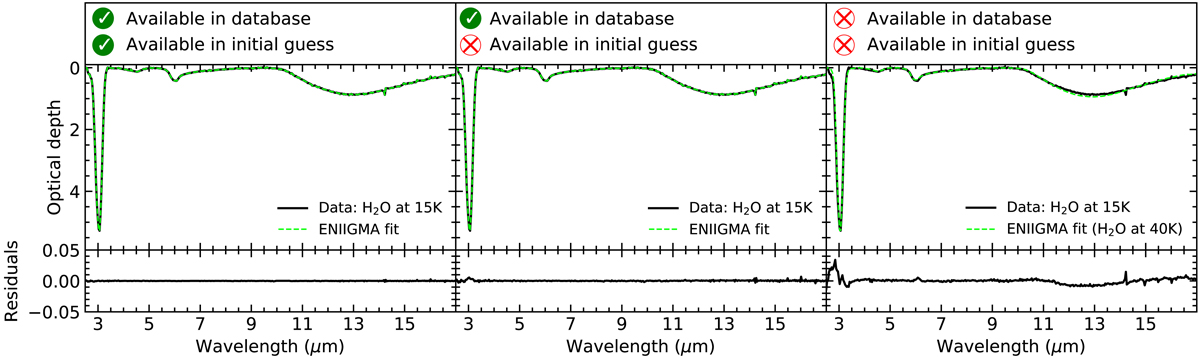
Fig. 3.
Download original image
ENIIGMA fit (dashed green line) of the pure H2O ice sample at 15 K (black line). Left and middle panels: fit in non-blind and blind tests, respectively. Right panel: fit when the correct solution does not exist. The residuals of the fit are shown in the boxes below the fits.
Current usage metrics show cumulative count of Article Views (full-text article views including HTML views, PDF and ePub downloads, according to the available data) and Abstracts Views on Vision4Press platform.
Data correspond to usage on the plateform after 2015. The current usage metrics is available 48-96 hours after online publication and is updated daily on week days.
Initial download of the metrics may take a while.