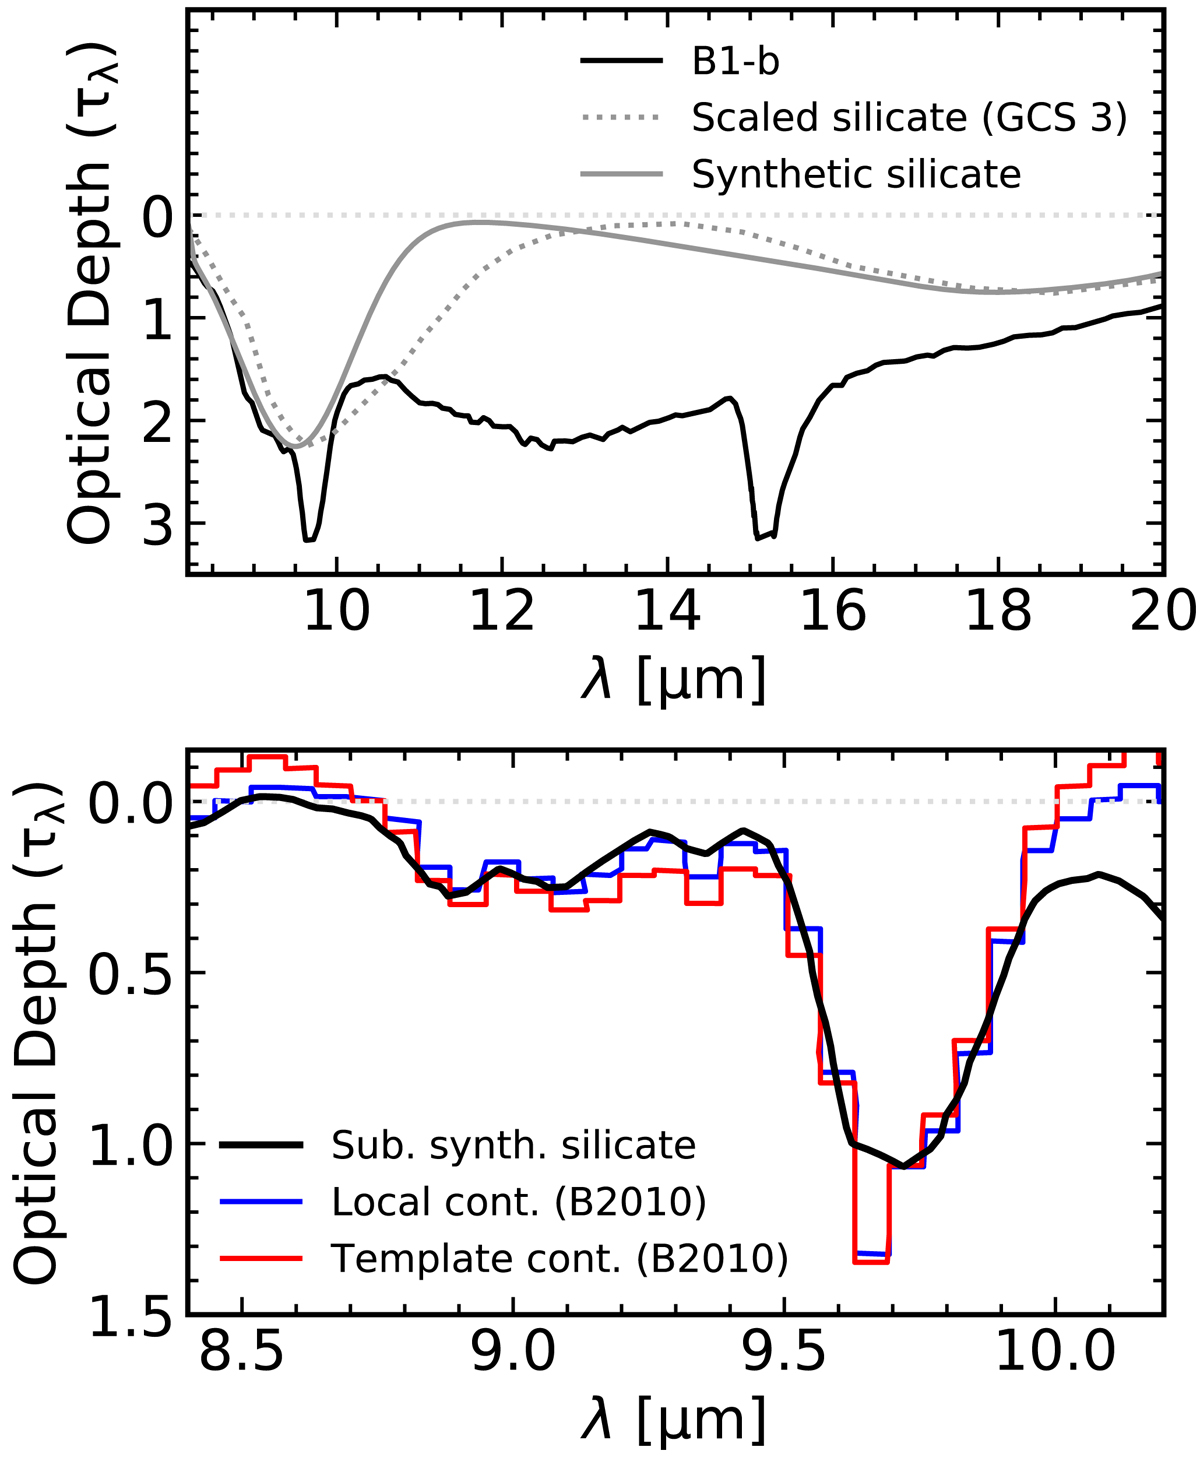
Fig. 2.
Download original image
Illustration of the silicate removal with the synthetic silicate method. Top: B1-b optical depth is shown by the black solid line, whereas the dashed and solid lines are the scaled GCS 3 silicate profile and the synthetic silicate feature, respectively. Bottom: residual optical depth after synthetic silicate removal (black line). The blue and red colours show the residual optical depth after local and template continuum methods, respectively (see text for details; Bottinelli et al. 2010).
Current usage metrics show cumulative count of Article Views (full-text article views including HTML views, PDF and ePub downloads, according to the available data) and Abstracts Views on Vision4Press platform.
Data correspond to usage on the plateform after 2015. The current usage metrics is available 48-96 hours after online publication and is updated daily on week days.
Initial download of the metrics may take a while.