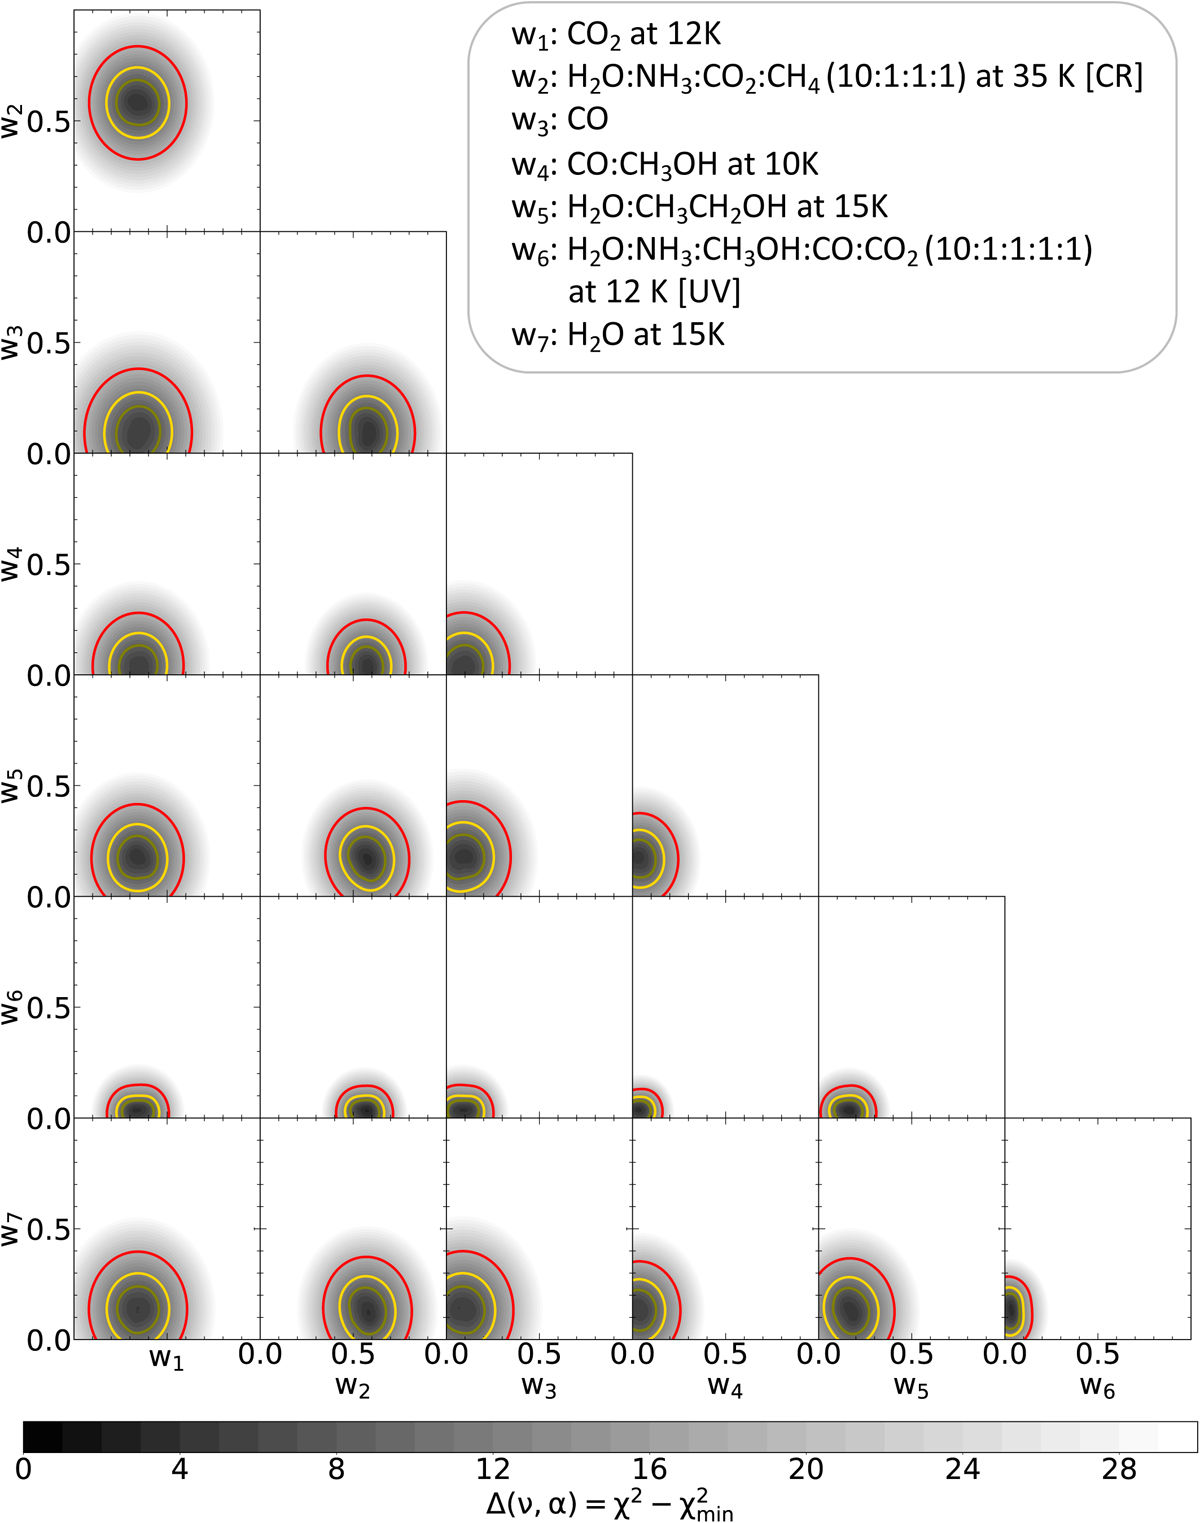
Fig. 19.
Download original image
Two-dimensional Δχ2 maps in grey scale showing the correlation among the linear combination coefficients of seven ice laboratory data used to decompose the Elias 29 spectrum. The green, yellow, and red contours indicate 1−3σ confidence intervals, respectively. For the seven components, they are defined for Δχ2 equal to 8.38, 12.02, and 18.48.
Current usage metrics show cumulative count of Article Views (full-text article views including HTML views, PDF and ePub downloads, according to the available data) and Abstracts Views on Vision4Press platform.
Data correspond to usage on the plateform after 2015. The current usage metrics is available 48-96 hours after online publication and is updated daily on week days.
Initial download of the metrics may take a while.