Fig. 16.
Download original image
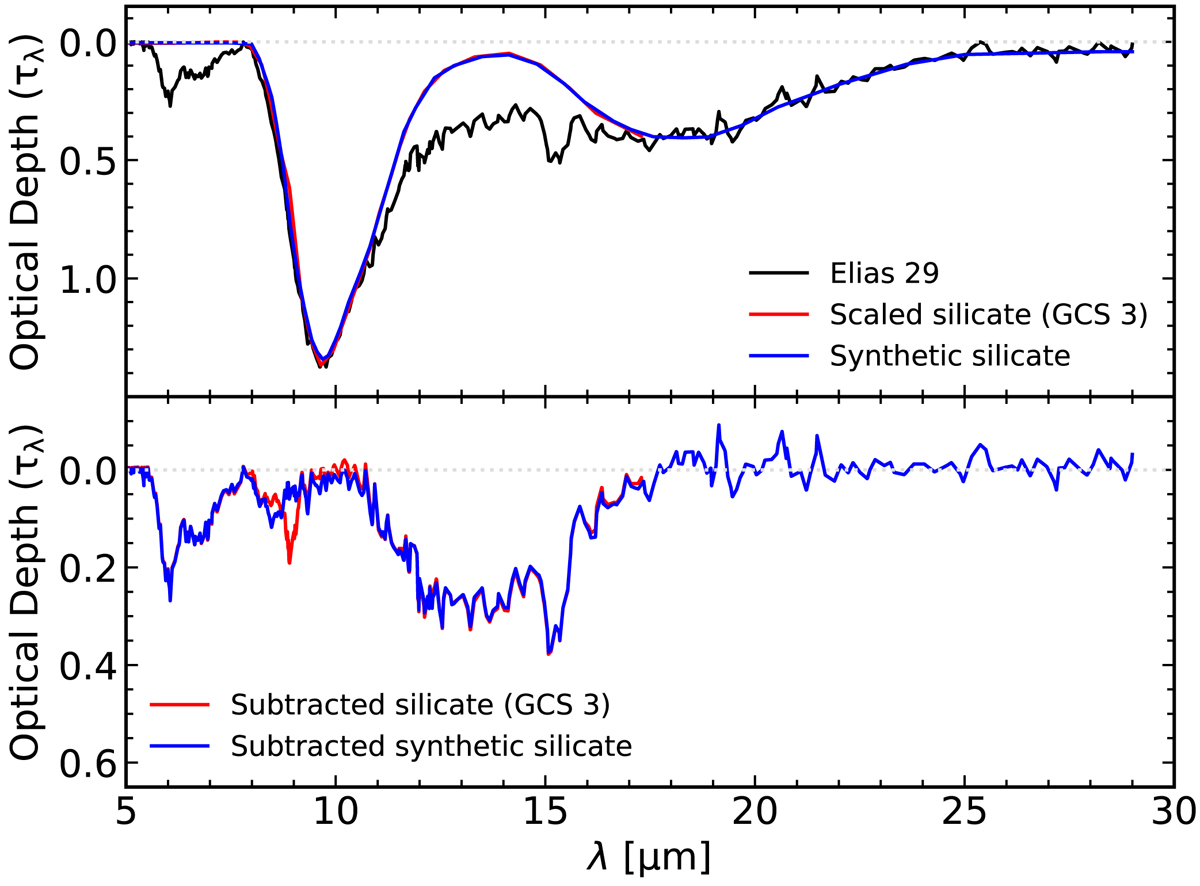
Silicate extraction procedure in the Elias 29 spectrum. Top: black line shows the optical depth scale of the Elias 29 spectrum calculated in this paper. Red and blue lines show, respectively, the scaled CGS 3 and synthetic silicate bands at 9.7 μm and 18 μm. Bottom: red and blues lines show the Elias 29 mid-IR optical depth after silicate band extractions with scaled CGS 3 and synthetic silicate profiles, respectively.
Current usage metrics show cumulative count of Article Views (full-text article views including HTML views, PDF and ePub downloads, according to the available data) and Abstracts Views on Vision4Press platform.
Data correspond to usage on the plateform after 2015. The current usage metrics is available 48-96 hours after online publication and is updated daily on week days.
Initial download of the metrics may take a while.