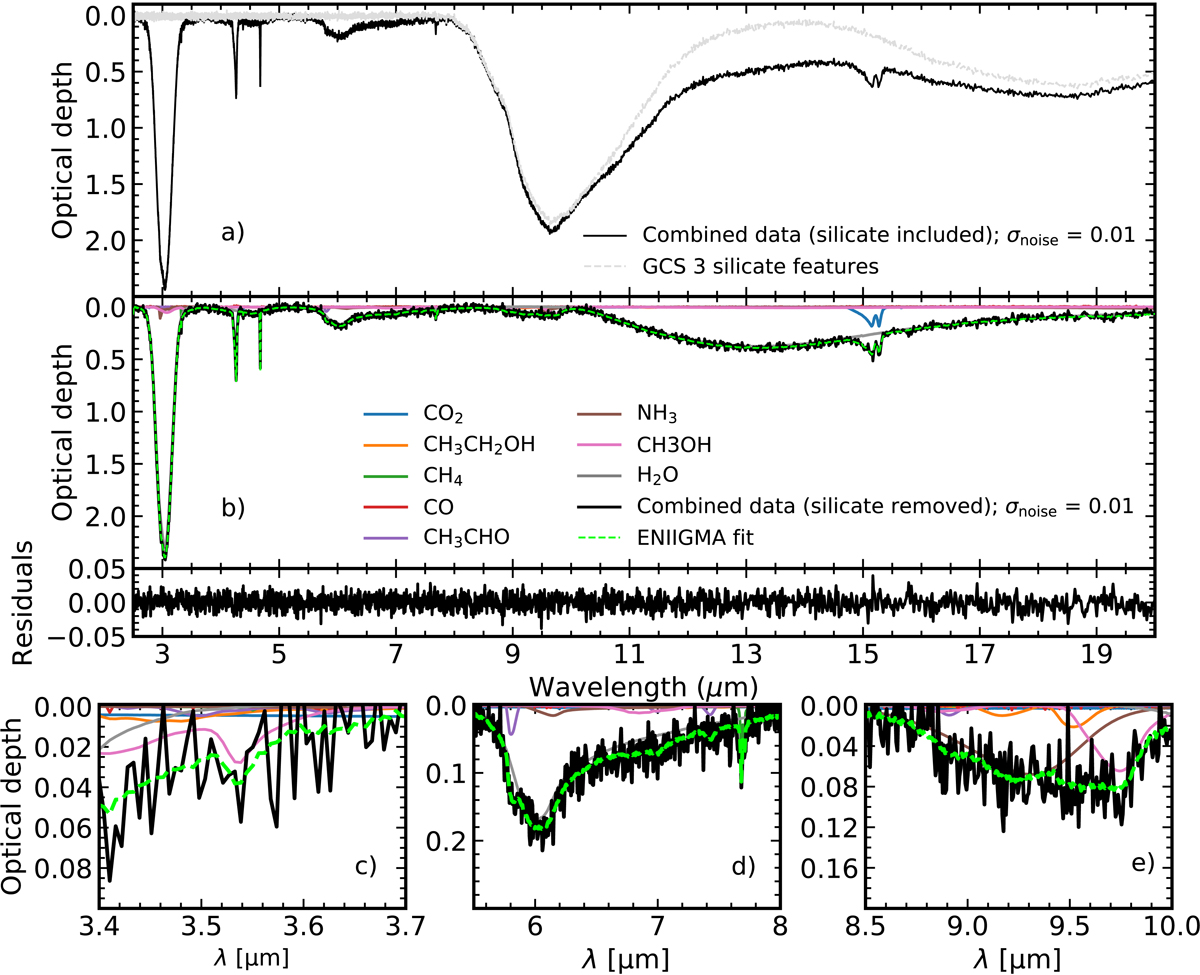
Fig. 14.
Download original image
Spectral decomposition of the synthetic ice spectrum composed of eight components of pure ice samples (black line) and Gaussian noise (σ = 0.01). Panel a: synthetic spectrum along with the silicate band from 2.5 − 20 μm. Panel b: synthetic spectrum without the silicate feature and residual plot. The ENIIGMA fit is shown by the dashed green line and the ice components by the other colours. Panels c–e: small spectral ranges highlighting the contribution of shallow bands.
Current usage metrics show cumulative count of Article Views (full-text article views including HTML views, PDF and ePub downloads, according to the available data) and Abstracts Views on Vision4Press platform.
Data correspond to usage on the plateform after 2015. The current usage metrics is available 48-96 hours after online publication and is updated daily on week days.
Initial download of the metrics may take a while.