Fig. 11.
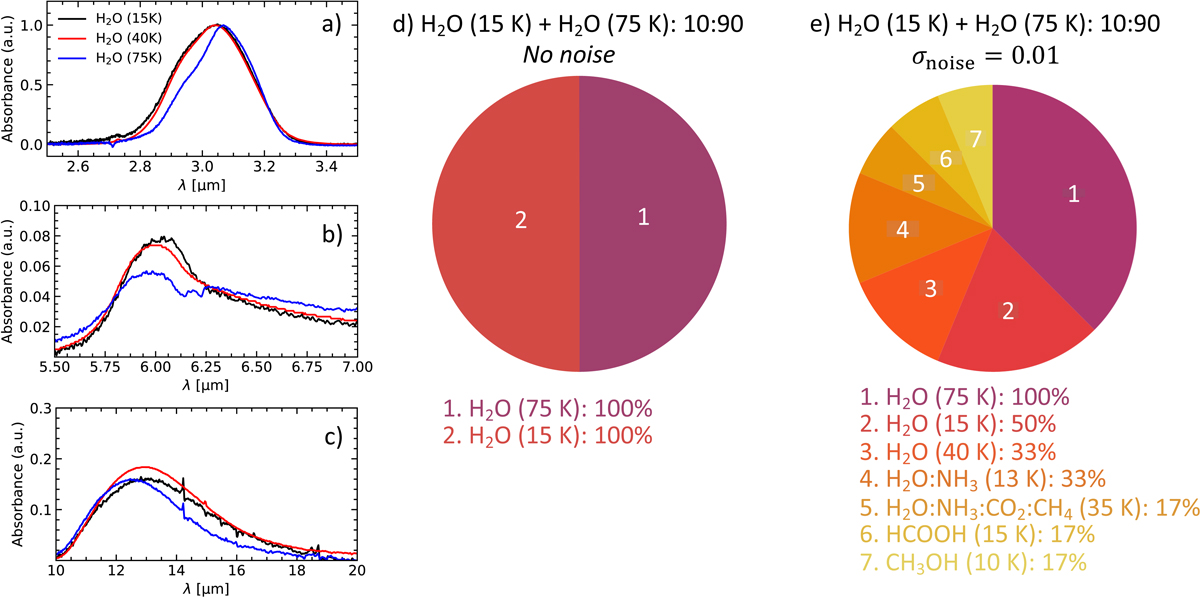
Download original image
Degeneracy analysis for the combination of H2O (15 K) + H2O (75 K): 10:90. Panels a–c: stretching, bending, and librational modes of H2O ice, respectively, at 15, 40, and 75 K. These panels highlight the temperature effect on the band shapes in the water ice IR spectra. Panel d: recurrence pie chart for the fit of the combined data H2O(15 K):H2O(75 K) with proportions 10:90 and without adding Gaussian noise to the spectrum. Panel e: same as panel d, but after adding Gaussian noise to the spectrum (σ = 0.01).
Current usage metrics show cumulative count of Article Views (full-text article views including HTML views, PDF and ePub downloads, according to the available data) and Abstracts Views on Vision4Press platform.
Data correspond to usage on the plateform after 2015. The current usage metrics is available 48-96 hours after online publication and is updated daily on week days.
Initial download of the metrics may take a while.