Free Access
Fig. E.1
Download original image
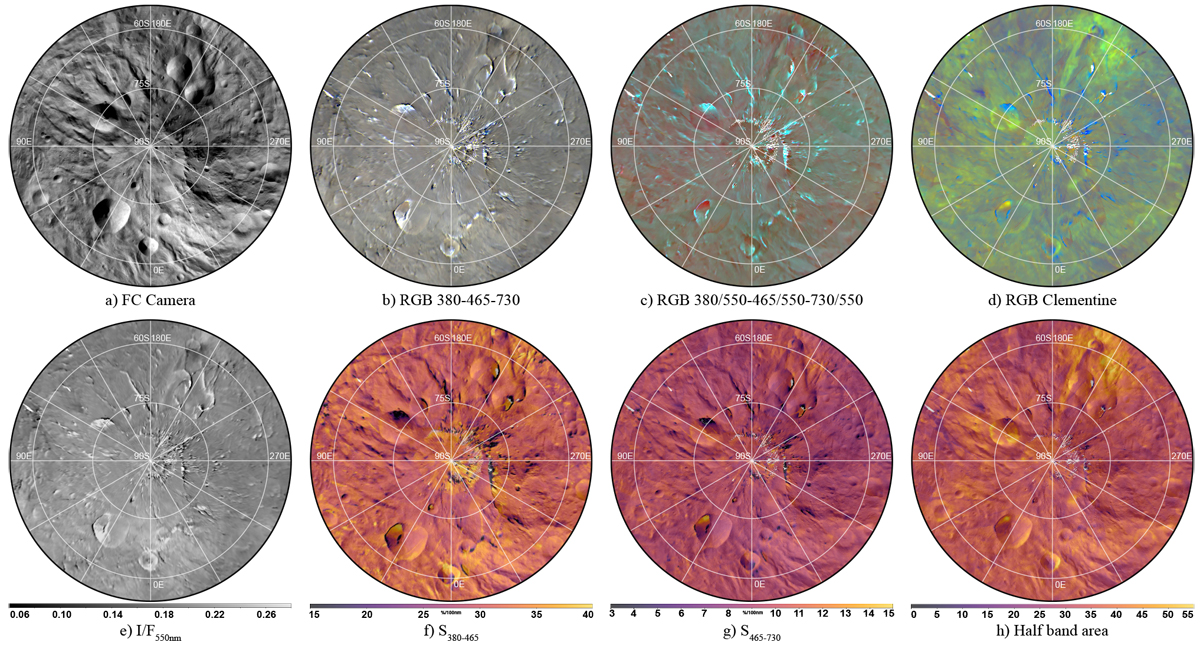
Map of the south pole of Vesta. Numbers refer to the features of Table 2 discussed in the text. The central peak fills the upper-left quarter of the image, from 90 to 180°E and from 0 to 60°S;
Current usage metrics show cumulative count of Article Views (full-text article views including HTML views, PDF and ePub downloads, according to the available data) and Abstracts Views on Vision4Press platform.
Data correspond to usage on the plateform after 2015. The current usage metrics is available 48-96 hours after online publication and is updated daily on week days.
Initial download of the metrics may take a while.