Fig. B.1
Download original image
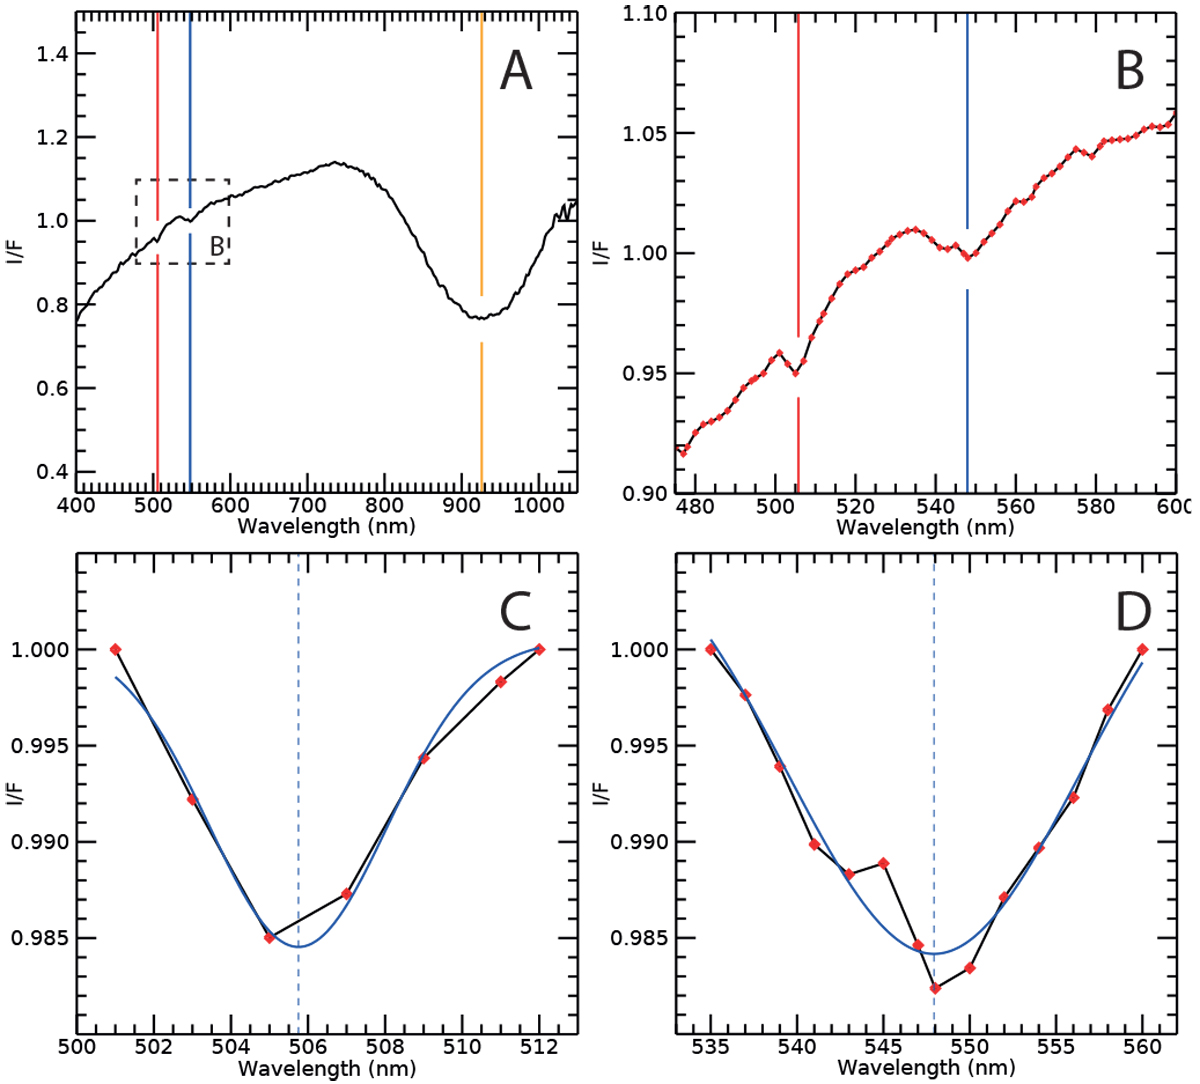
Example of a single VIR visible spectrum and results of the SF1 and SF2 fits. a) VIR visible spectrum from 400 nm to 1050 nm. b) Zoom-in on the SF1 and SF2 bands between 475 nm to 600 nm. c) and d) Continuum removed SF1 and SF2 bands, respectively. In the different panels: the red, blue and orange plain vertical lines indicate the center of the SF1, SF2 and BI, respectively. Red symbols correspond to the original positions of the VIR spectral channels. The plain blue curves show the results of the fits by the Gaussian functions recomputed with a sampling of 0.1 nm. The dashed vertical blue lines indicate the peak centroids of the Gaussian functions, corresponding to the band centers.
Current usage metrics show cumulative count of Article Views (full-text article views including HTML views, PDF and ePub downloads, according to the available data) and Abstracts Views on Vision4Press platform.
Data correspond to usage on the plateform after 2015. The current usage metrics is available 48-96 hours after online publication and is updated daily on week days.
Initial download of the metrics may take a while.